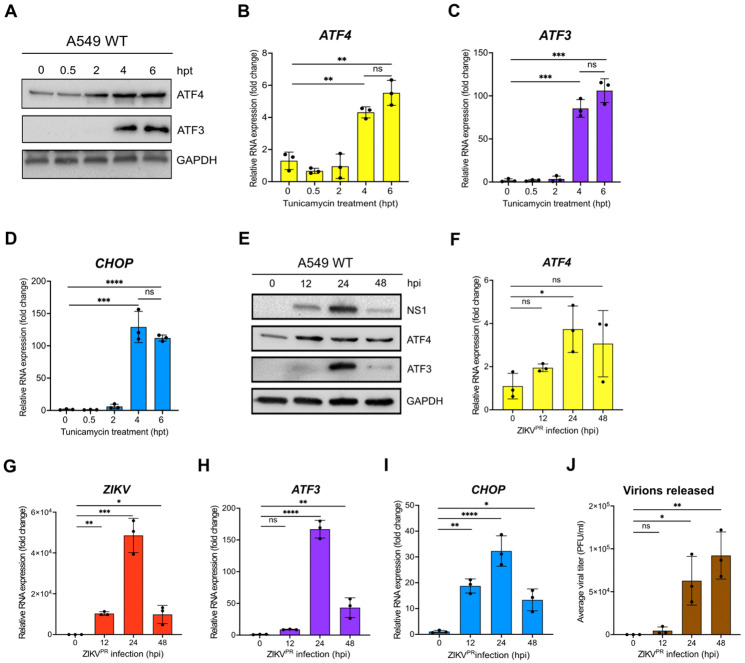
Figure 1. ATF3 expression is induced by chemical and viral induction of ER stress.
(A-D) A549 cells were treated with 2 nM tunicamycin (TU) and harvested at 0-, 0.5-, 2-, 4- and 6-hours after treatment. (A) Cellular proteins ATF3 and ATF4 were analyzed by western blot. GAPDH was used as the loading control. The western blot shown is representative of at least 3 independent experiments. (B-D) The fold change of ATF4, ATF3 and CHOP mRNA levels relative to β-actin mRNA were also determined by RT-qPCR. (E-J) A549 WT cells were infected with ZIKV PRVABC (moi of 10 PFU/cell) for 0-, 12-, 24- or 48-hours. (E) Cellular and viral proteins were assayed by western blot with GAPDH as the loading control. Protein levels are representative of at least 3 independent experiments. (F-I) RT-qPCR analyses were used to determine the fold change in expression of ATF4, ZIKV, ATF3 and CHOP mRNAs, where the specific mRNA was normalized to β-actin mRNA. (J) Viral titers from virions released into the media at each time point were determined by plaque assay. N=3, and error bars show ± SD. Statistical significance was determined by Student T-test. *p<0.01, **p<0.001, ***p<0.0005, ****p<0.0001, ns-not significant.

