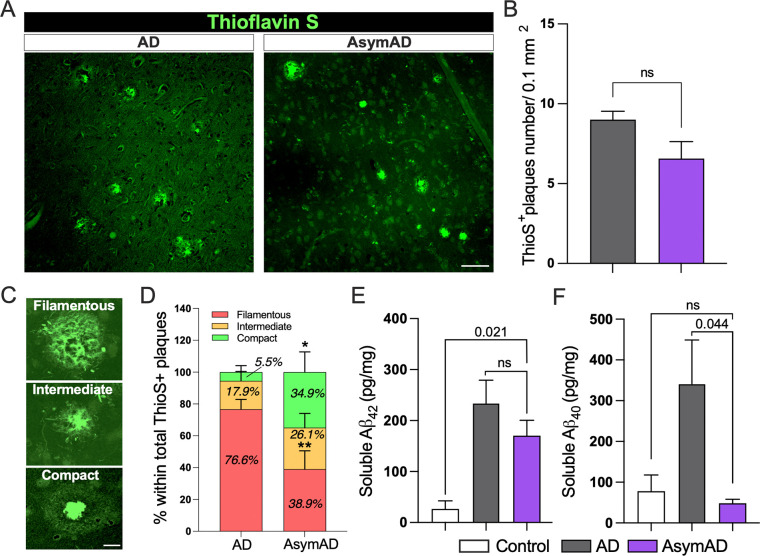
Figure 1: Morphologically distinct proportion of thioflavin S amyloid plaques and Aβ isoform levels in AsymAD cases compared to Alzheimer’s disease cases.
A. Thioflavin S staining of middle frontal gyrus from AD and AsymAD subjects. Scale bar: 40 μm B. Quantification of total number of thioflavin S plaques. Data is shown as mean ±SEM, unpaired Student’s t-test, n=14 cases per condition (n.s; 0.156) C. Representative morphologies of each plaque type, classified based on circularity score. Scale bar: 10 μm D. Proportion of filamentous, intermediate, and compact thioflavin S plaques were quantified. n=14 cases per condition and 15–18 plaques per case were analyzed. Data is shown as ±SEM, 2-way ANOVA and Bonferroni’s multiple comparisons test (p-value *; 0.042 and **;0.001) E-F. Aβ42 (E) and Aβ40 (F) levels using Meso Scale Discovery assay in total soluble MFG extracts. Data is shown as mean ±SEM, one-way ANOVA, following Tukey’s multiple comparisons test (n.s.; 0.394 and n.s.; 0.952 for Aβ42 and Aβ40, respectively), n=6–8 cases per condition.

