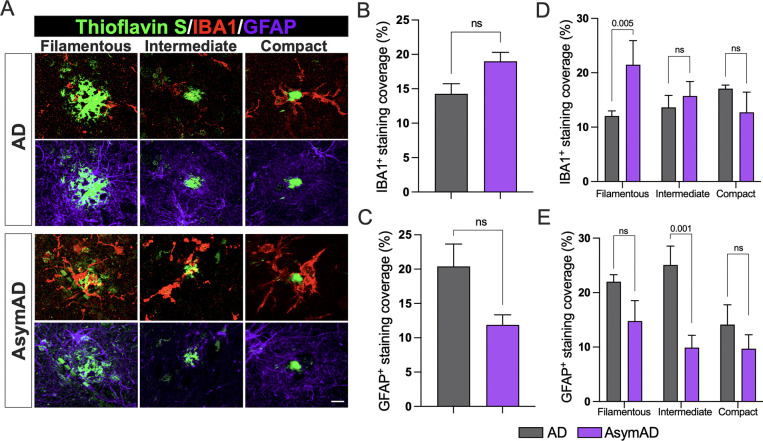
Figure 2: Microglia and astrocytic coverage around compact, intermediate, and filamentous amyloid plaques between AD and AsymAD cases.
A. Staining against the activated microglia marker IBA1 (red) and the activated astrocytic marker GFAP (purple) around the three previously classified thioflavin S amyloid plaque phenotypes B-C. Overall IBA1 (B) and GFAP (C) coverage quantification. Data is shown as mean ±SEM, unpaired Student’s t-test, n=14 cases, per condition (n.s.; 0.097 and 0.076, respectively) D-E IBA1 (D) and GFAP (E) coverage per plaque phenotype. Data is shown as ±SEM, 2-way ANOVA, following Šídák’s multiple comparisons test, n=14 cases, per condition.

