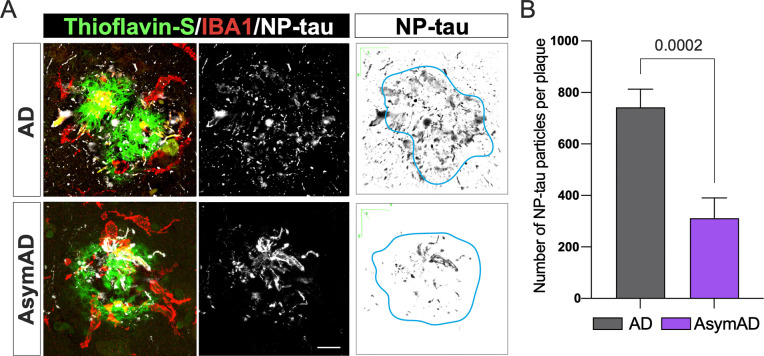
Figure 3: Tau aggregates in dystrophic neurites (NP-tau) surrounding filamentous amyloid plaques in AD compared to AsymAD cases.
A. Confocal pictures of NP-Tau (AT8 – white) and microglia (IBA1 - red) together with plaques (thioflavin S - green) of AD and AsymAD cases. Black and white images are 3D reconstruction of NP-Tau particle distribution surrounding amyloid plaques. Light blue line indicates plaque location and shape in the original picture. Scale bar: 10 μm B. Number of NP-tau particles per plaque using the “Analyze Particles” plugin of Fiji. Data is shown as mean ±SEM, unpaired Student’s t-test. n=20–30 plaques per condition.

