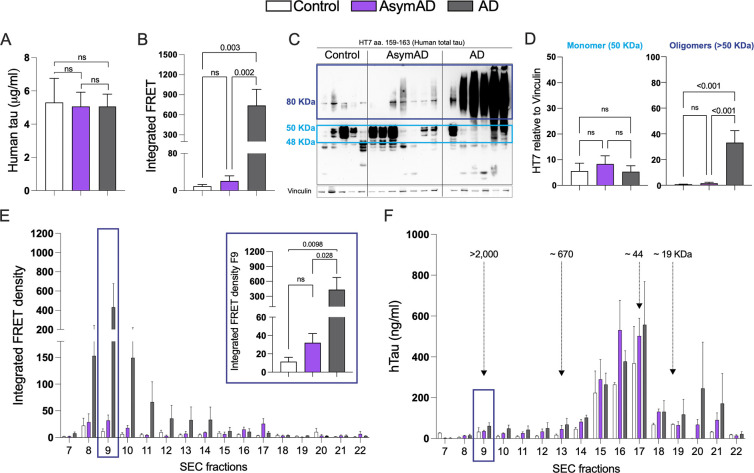
Figure 4: Tau seeding activity and biochemical characterization of Tau in AD, AsymAD, and age-matched control subjects.
A. Total tau detected by ELISA in total MFG protein fractions from control, AsymAD, and AD subjects B. Tau seeding activity of total protein fractions C-D. Western blot of total HT7 and quantifications of the monomer band (between 40–50 kDa, light blue) and the oligomers bands (dark blue) (D). Data is shown as ±SEM, n.s. p-value > 0.05. Experiments were performed with n=13–15 cases?? (ELISA and tau seeding activity) and n=5–7 cases?? (Western blot) E. Tau seeding activity of SEC fractions. The inset shows the seeding activity of SEC fraction 9 (F9) containing the high molecular weight tau (>2000 kDa). Significance was determined by one-way ANOVA, n.s. p-value > 0.05 F. Total tau detected by ELISA in SEC fractions from MFG brain lysates. Data is shown as ±SEM. Experiments were performed with n=4 cases per condition.

