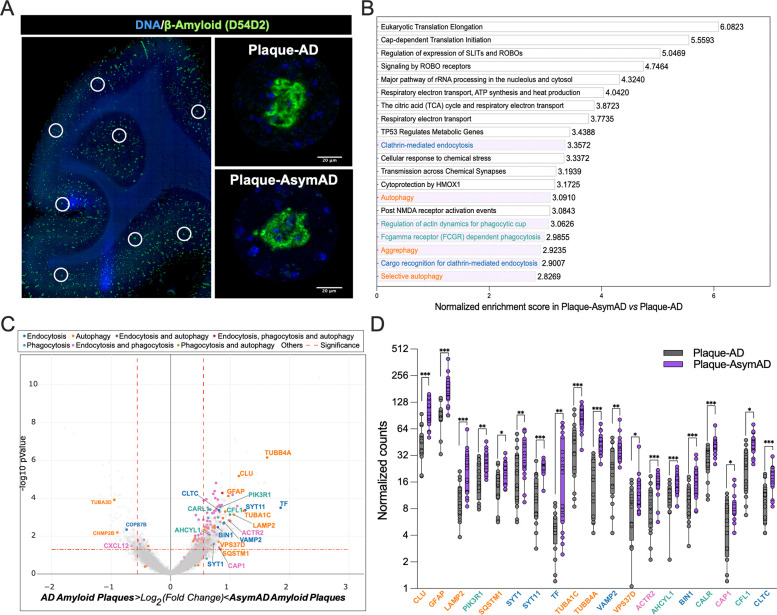
Figure 5: Characterization of AsymAD and AD plaque niche using spatial whole transcriptomics.
A. After staining with Aβ-amyloid (green) and DNA (blue), areas of illumination (AOIs) containing Aβ-amyloid plaques in AD and AsymAD cases were selected. n=2 plaques?? per case. B. Top 20 pathway enrichment signatures in AsymAD amyloid plaques AOIs. p-value < 0.001 adjusted for multiple analyses using Benjamini-Hochberg procedure with a false discovery rate (FDR) of 0.01 C. Volcano plot of AsmAD vs AD differential expression, highlighting genes from the pathways shown in B. Vertical dashed lines indicates a fold change over 1.5 (log2 FC = ± 0.58) and horizontal dashed indicates p value of 0.05 (−log10 p-value = 1.3). D. Normalized counts of the genes highlighted in C. Data is shown as ±SEM, 2-way ANOVA, following Šídák’s multiple comparisons test, one dot represents one AOI. n=16-18, per condition (p-value ***<0.0001, **;<0.0001 and *;<0.05).

