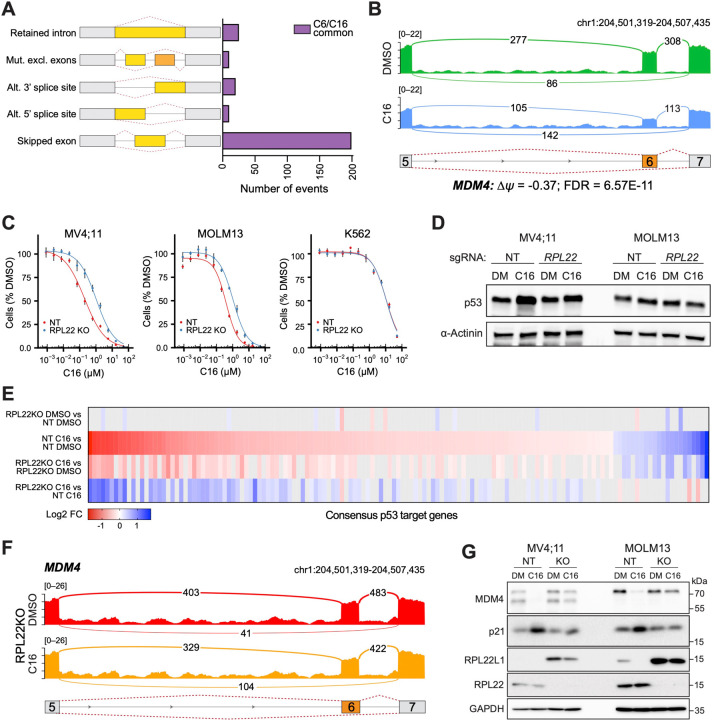
Figure 6. WINi inactivate MDM4 in an RPL22-dependent manner.
(A) Differential alternative splicing events affected by C6/C16 treatment of MV4;11 cells were quantified by rMATS. The types of alternative splicing events are cartooned at left, and the number of significantly different events (> 5% Δψ; FDR < 0.05) common to C6/C16 depicted in the graph. See Figure 6—source data 2 for output of rMATS analysis. (B) Sashimi plot quantifying read junctions that span exons 5–7 of MDM4 in MV4;11 cells treated with DMSO (green) or C16 (blue). Numbers in the arcs display junction depth. The location of exons 5, 6, and 7 is depicted at the bottom; skipped exon 6 is highlighted in orange. (C) Viabilities of control (non-targeting: NT) and RPL22 knock out (KO) MV4;11, MOLM13, and K562 cells treated with a serial dilution range of C16 for 72 hours, relative to viability of DMSO-treated cells (n = 3; Mean ±SEM). (D) Western blot analysis of p53 levels in control (NT) and RPL22 knockout (KO) MV4;11 and MOLM13 cells treated with either 0.1% DMSO or C16 (MV4;11, 200 nM; MOLM13, 400 nM) for 72 hours. α-Actinin is loading control. Representative images from three biological replicates shown. Raw unprocessed gel images are presented in Figure 6—source data 5. (E) Heatmap, showing significant changes in the expression of consensus p53 target genes (Fischer, 2017) between the indicated pairwise comparisons of RNA-Seq datasets. Note that only consensus p53 target genes altered in expression by C16 in control (NT) cells are represented. (F) Sashimi plot quantifying read junctions that span exons 5–7 of MDM4 in RPL22KO MV4;11 cells treated with DMSO or C16. Numbers in the arcs display junction depth. The location of exons 5, 6, and 7 is depicted at the bottom; skipped exon 6 is highlighted in orange. Corresponding NT images are presented alongside RPL22KO images in Figure 6—figure supplement 3B). (G) Western blots, comparing the effects of 72 hours of DMSO (DM) or C16 treatment (MV4;11, 200 nM; MOLM13, 400 nM) of control (NT) or RPL22 knockout (KO) MV4;11 (left) or MOLM13 (right) cells on levels of MDM4, p21, RPL22L1, RPL22, and GAPDH (loading control). Representative images from three biological replicates are shown. Raw unprocessed gel images are presented in Figure 6—source data 9.

