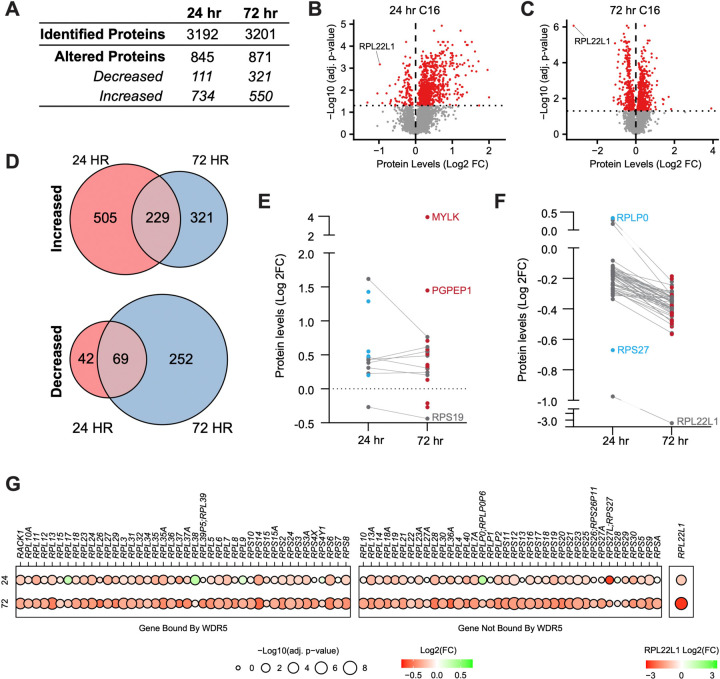
Figure 3. Impact of WINi on the ribosome inventory of MLLr cancer cells.
(A) Lysates from MV4;11 cells treated 24 or 72 hours with either 0.1% DMSO or 250 nM C16 were subjected to liquid chromatography coupled with tandem mass spectrometry and analyzed by label-free quantification (LFQMS). The table shows the number of proteins detected in DMSO and C16 samples and those with significantly altered levels at each time point (n = 4; adj. p-value < 0.05). See Figure 3—source data 1 for complete output of LFQMS analysis. (B) Volcano plot, showing protein level alterations in cells treated with C16 for 24 hours (red indicates adj. p-value < 0.05). The location of RPL22L1 is indicated. (C) As in (B) but for 72 hour treatment with C16. (D) Overlap of proteins significantly increased (top) or decreased (bottom) following 24- or 72-hour C16-treatment. (E) Protein level alterations induced by C16 in consensus p53 target proteins (Fischer, 2017) at the 24 and 72 hour treatment timepoints. Those proteins only altered in abundance at 24 hours are represented as blue dots; proteins only altered at 72 hours are red; proteins altered at both timepoints are grey. (F) As in (E) but for ribosomal proteins. (G) Changes in expression of proteins encoded by WDR5-bound (left) and non-bound (right) RPGs elicited by 24 (top) or 72 (bottom) hour treatment with C16. Note that, due to the magnitude of change, Log2(FC) for RPL22L1 is presented on a separate scale.

