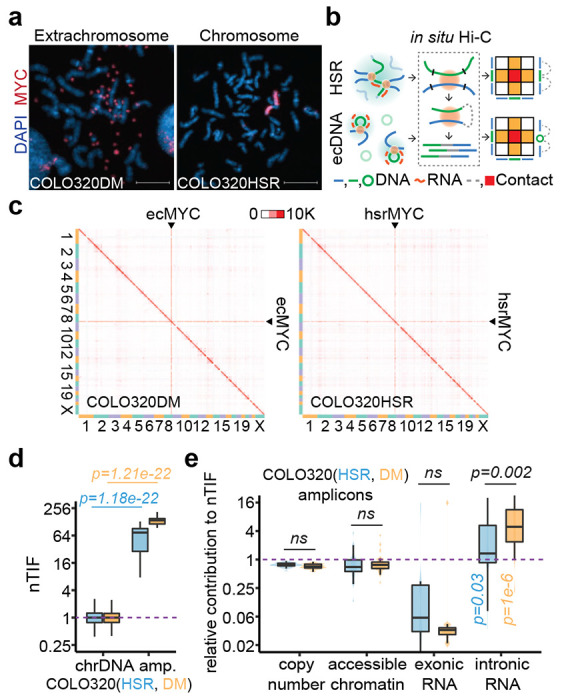
Figure 1. Elevated chromosomal interactions of ecDNA were enriched for unspliced RNA.

(a) Representative MYC DNA FISH images showing ecDNA and HSR in metaphase chromosome spreads. Scale bars, 10 μm.
(b) Schematic of in situ Hi-C assay detecting chromatin interactions of HSR or ecDNA. Amplicon chromatins from COLO320HSR cells (HSR, green line) or COLO320DM cells (ecDNA, green circle) were fragmented by restriction enzyme (black line) and ligated to chromosomal DNA (blue line) in proximity, resulting as interacting-frequency based contact heatmap (colored square).
(c) In situ Hi-C contact heatmap for COLO320DM or COLO320HSR in the order of mapping position (chromosome 1 to 22, X) with ecMYC or hsrMYC labeled. Scale bars, 10,000 interacting reads.
(d) Normalized trans-interaction frequency (nTIF) for DNA bins (50 kb resolution). nTIF of chromosomal DNA was scaled with the median of 1 (dotted line), and relative nTIF of hsrMYC (blue) and ecMYC (orange) were represented in the boxplot (One-sided Wilcoxon Rank Sum Test).
(e) Normalization power of copy number (measured by WGS), accessible chromatin (measured by ATAC-seq), exonic RNA (measured by RNA-seq-derived exonic reads), or intronic RNA (measured by RNA-seq-derived intronic reads) for each binned nTIF. Normalization power of chromosomal DNA was scaled to the median of 1 (dotted line), and relative contribution of hsrMYC (blue) and ecMYC (orange) was shown in the boxplot (One-sided Wilcoxon Rank Sum Test. ns: not significant).
