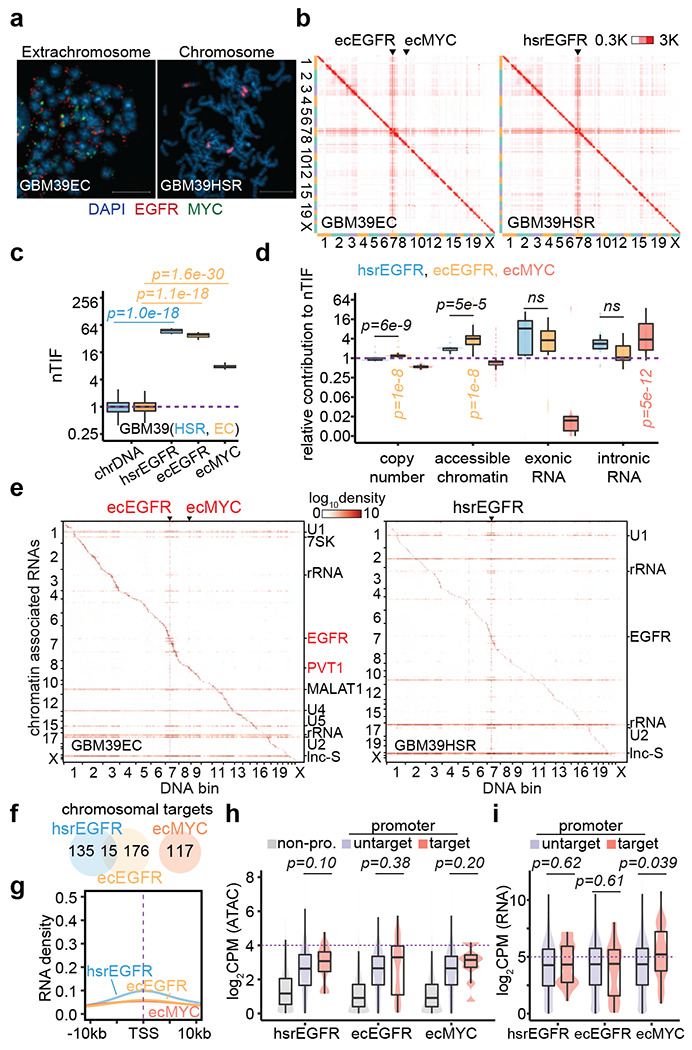
Figure 3. Limited mobile targeting of ecDNA in GBM39 cells.

(a) Representative FISH images showing EGFR and MYC ecDNAs in GBM39EC and EGFR HSR in GBM39HSR cells at metaphase. Scale bars, 10 μm.
(b) In situ Hi-C contact heatmap for GBM39EC and GBM39HSR cells in the order of mapping position (chromosome 1 to 22, X) with ecEGFR, ecMYC, and hsrEGFR labeled. Scale bars, 300 to 3,000 interacting reads.
(c) Normalized trans-interaction frequency (nTIF) for DNA bins (50 kb resolution) presented similarly as in Figure 1d (one-sided Wilcoxon Rank Sum Test).
(d) Normazliation power of copy number, accessible chromatin, exonic RNA, or intronic RNA for each binned nTIF as in Figure 1e (one-sided Wilcoxon Rank Sum Test; ns, not significant).
(e) Heatmap showing chromatin-enriched RNAs interacted across the whole genome in the order of mapping position, with rows for chromatin-enriched RNAs and columns for DNA bins in 2-Mb resolution. ecEGFR, ecMYC, and hsrEGFR were labeled on top, and major trans-chromosomal interacting RNAs were labeled on the right (ecDNA-derived RNAs in red). Scale bars, 1og-10 relative enrichment.
(f) A Venn diagram shows the number of chromosomal targets interacted by ecEGFR, ecMYC, or hsrEGFR-derived RNAs in GBM39EC or GBM39HSR cells.
(g) Meta-analysis of ecEGFR, ecMYC, or hsrEGFR targeted chromosome regions relative to annotated TSS. Interacting RNAs were weighted for ecEGFR (orange), ecMYC (red), and hsrEGFR (blue).
(h) Quantification of chromatin accessibility by ATAC-seq. Grey, non-promoter regions; Red, hsrEGFR, ecEGFR, or ecMYC targeted promoters; Purple, non-targeted promoters. P-values were calculated by one-sided Wilcoxon Rank Sum Test.
(i) Quantification of chromosomal genes expression by RNA-seq. Red, genes with promoters targeted by hsrEGFR, ecEGFR, or ecMYC; Purple, genes with promoters untargeted. P-values were calculated by one-sided Wilcoxon Rank Sum Test.
