
Figure 4. ecDNA-borne nascent noncoding RNAs mediate ecDNA interactome and transcriptional regulation in trans.
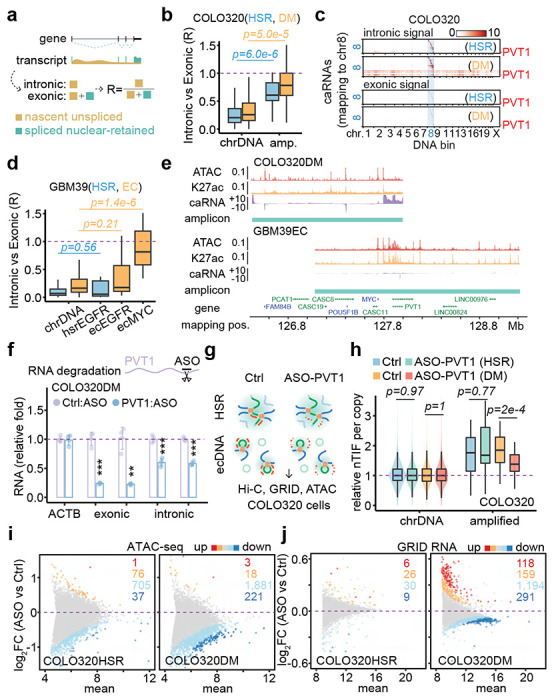
(a) Schematic of nascent unspliced RNA signal and spliced nuclear-retained RNA signal.
(b) Quantification of caRNA signal as intronic vs exonic ratio for COLO320HSR (blue) and COLO320DM (orange) cells. P-values were calculated by one-sided Wilcoxon Rank Sum Test.
(c) Heatmaps of hsrMYC or ecMYC-derived RNAs interacting with the genome in the order of mapping position. Top heatmaps, intronic caRNA derived. Bottom heatmaps, exonic caRNA-derived. Scale bars, log-10 relative enrichment.
(d) Quantification of caRNA signal as intronic vs exonic ratio for cells GBM39HSR (blue) and GBM39EC (orange). P-values were calculated by one-sided Wilcoxon Rank Sum Test.
(e) Genomic tracks showing ATAC-seq, H3K27ac ChIP-seq, and GRID-seq-derived RNA (strand-specific, in two scaled views) signals normalized to CPM in COLO320DM cells. Amplicons were determined by AmpliconArchitect software.
(f) qRT-PCR for relative RNA levels of internal control ACTB, exonic and intronic PVT1, comparing PVT1 knockdown to control in COLO320DM cells (two-sided Student’s t-test).
(g) Schematic of in situ Hi-C, GRID-seq, and ATAC-seq assays in COLO320HSR (top) and COLO320DM (bottom) cells treated by control or PVT1 ASO knockdown.
(h) Quantification of copy number normalized nTIF for chromosomal DNA bins (scaled to median of 1) and relative nTIF of HSR or ecDNA treated by control or PVT1 knockdown (one-sided Wilcoxon Rank Sum Test).
(i) Scatter plot of log-2 fold change of normalized ATAC-seq signal upon PVT1 knockdown against the control sample. Highlighted are promoters with signal significantly increased (red, FDR<0.01; orange, FDR<0.05) or decreased (dark blue, FDR<0.01; light blue, FDR<0.05).
(j) Scatter plot of log-2 fold change of normalized GRID-seq-derived RNA expression upon PVT1 knockdown against the control sample. Highlighted are genes with expression significantly increased (red, FDR<0.01; orange, FDR<0.05) or decreased (dark blue, FDR<0.01; light blue, FDR<0.05).