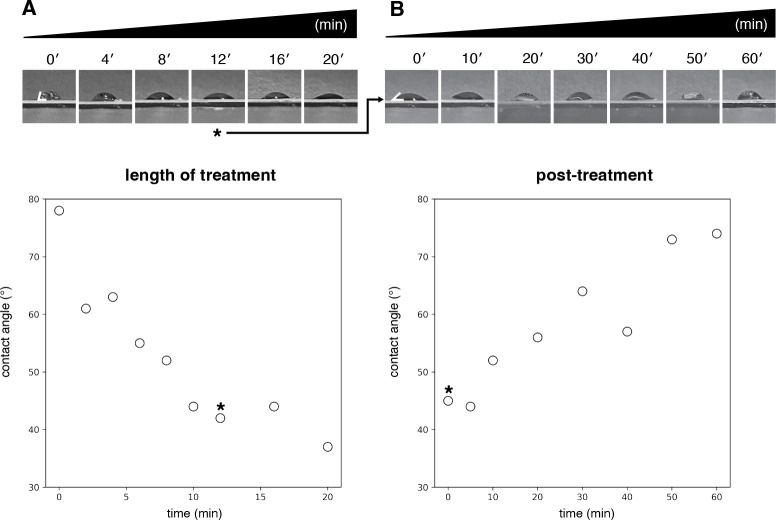
Figure 3: Assessment of grid surface hydrophilicity as a function of duration of UV/ozone treatment and time elapsed post-treatment.
A) Measured contact angles plotted as a function of the duration of treatment. Decreased contact angles are consistent with increased hydrophilicity (untreated grid: 78°; 20 min treatement: 37°). Contact angles measured using ImageJ43. B) Measured contact angles plotted as a function of time, post treatment (0 min: 45°; 60 min: 74°). Grid measured in the post treatment time-course was UV/ozone treated for 12 minutes, as indicated by asterisk. Each post-treatment measurement was performed on the same grid, with the sample removed by wicking between measurements. Specific contact angles measured are expected to vary as a function of laboratory environmental conditions, and we recommend that users perform similar experiments in their laboratories to identify suitable conditions. See Supplemental Protocol 1 for more information.

