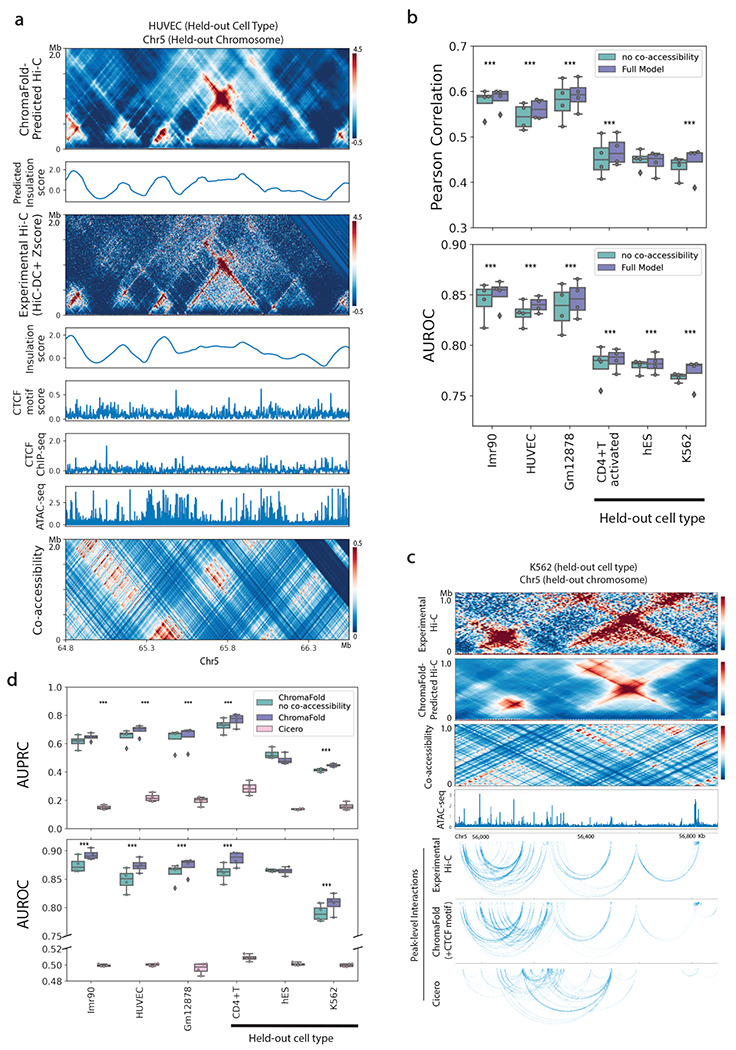
Figure 2. Co-accessibility information improves contact map prediction in new cell types.

a. Visualization of real vs. ChromaFold-predicted Hi-C contact map, insulation scores, epigenetic tracks, and co-accessibility on held-out chromosome 5 in HUVEC. b. Quantitative evaluation of Hi-C map prediction performance by ChromaFold, with and without the co-accessibility input, across training and held-out human cell types/tissues. Box plots show (top) the averaged distance-stratified Pearson correlation between the experimental and predicted contact map and (bottom) the averaged distance-stratified AUROC of significant interactions (top 10% in Z-score), per held-out chromosome. Paired t-test is performed on the distance-stratified person correlation across test chromosomes (P-value: *: <0.05, **: < 0.01, ***: < 0.001). c. Visualization of ChromaFold-predicted Hi-C contact map and significant peak-level interactions and Cicero-predicted peak-level interactions in held-out cell type K562 on held-out chromosome 5. d. Quantitative evaluation of significant peak-level prediction performance by ChromaFold and Cicero. Box plots show the AUPRC (top) and AUROC (bottom) of significant peak-level interaction prediction per held-out chromosome. Statistical test is the same as above. The paired t-test P-value for both ChromaFold models vs. Cicero are < 0.0001.
