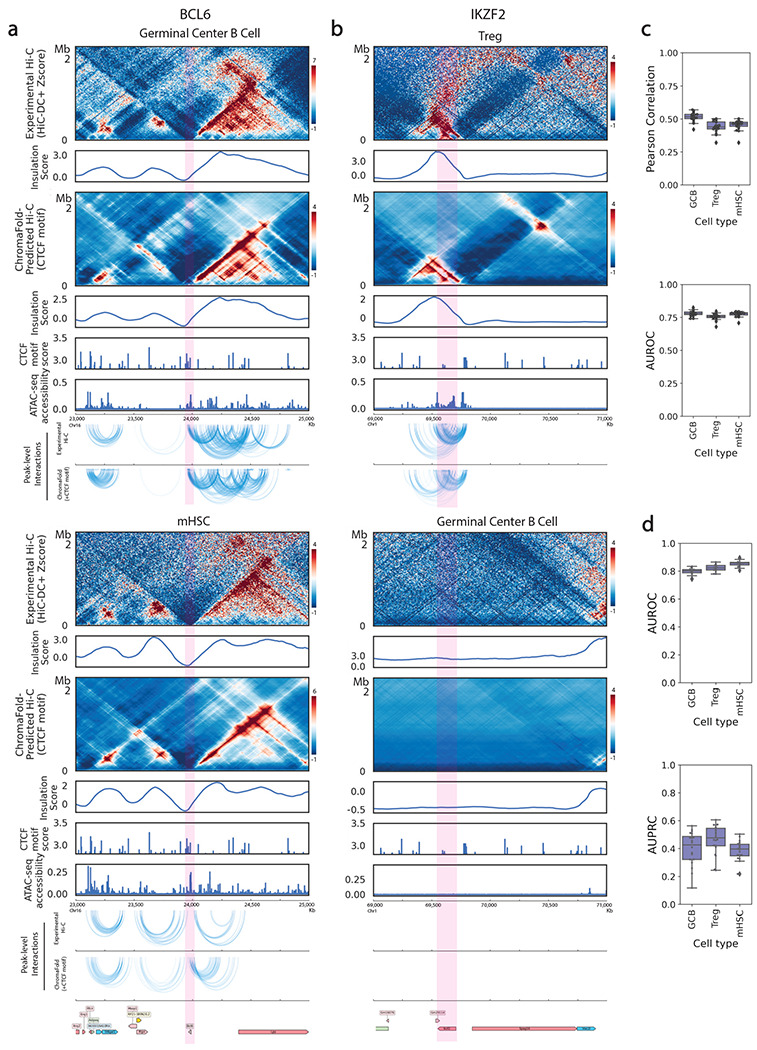
Figure 4. ChromaFold accurately generalizes across cell types and species.

a, b. Comparison of experimental vs. ChromaFold-predicted Hi-C contact map and peak-level interactions at different loci in the mouse genome across different murine cell types: the Bcl6 gene locus in mouse germinal center B cells (a, top) and in mHSC (a, bottom) and the Ikzf2 gene locus in regulatory T cells (b, top) and germinal center B cells (b, bottom). c. Box plots show (top) the averaged distance-stratified Pearson correlation and AUROC of significant interactions (bottom; top 10% in Z-score), per held-out chromosome across mouse cell types. d. Box plots show the AUPRC (top) and AUROC (bottom) of significant peak-level interaction prediction per held-out chromosome across mouse cell types.
