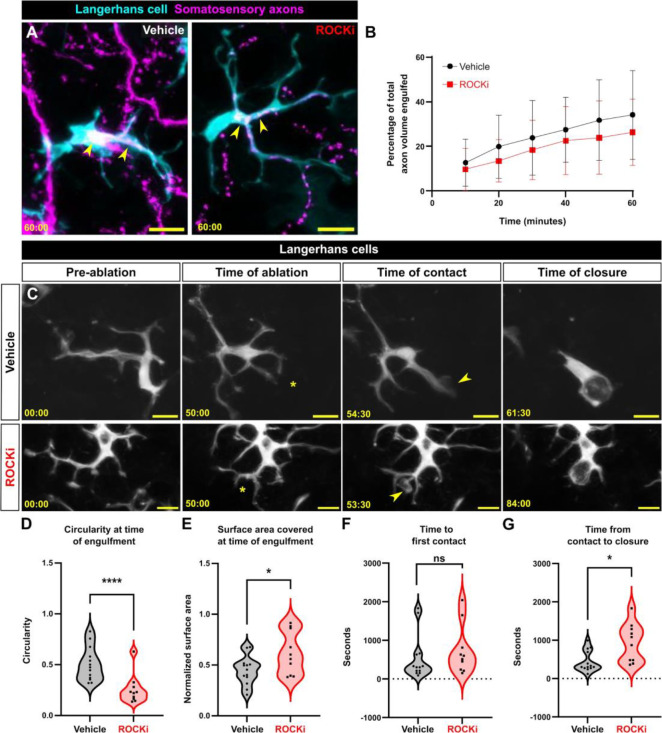
Figure 5. Effects of ROCK inhibition on engulfment of axonal and keratinocyte debris.
A. Still images showing Tg(mpeg1:NTR-EYFP)-positive Langerhans cell engulfing Tg(p2rx3a:mCherry)-positive axonal debris after vehicle treatment or ROCK inhibition. Yellow arrowheads indicate engulfed axonal debris. B. Quantification of axonal volume engulfed in vehicle or ROCKi conditions. n = 12 cells from N = 10 scales for vehicle, n = 16 cells from N = 9 scales for ROCKi. C. Still images showing Tg(mpeg1:NTR-EYFP)-positive Langerhans cells after vehicle treatment (top row) or ROCK inhibition (bottom row) in the context of cell ablation. Asterisks denote sites of laser ablation. Arrowheads denote sites of contact with debris. D. Violin plots of circularity at time of engulfment. n = 13 cells, N = 3 scales for vehicle and n = 15 cells, N = 4 scales for ROCKi. E. Violin plots of surface area covered at time of engulfment. n = 13 cells for vehicle, N = 3 scales and n = 15 cells, N = 4 scales for ROCKi. F. Violin plots of the amount of time from ablation to first contact of debris. n = 13 cells, N = 3 scales for vehicle and n = 15 cells, N = 4 scales for ROCKi. G. Violin plots of the amount of time from first contact of debris to closure of phagocytic cup. n = 13 cells, N = 3 scales for vehicle and n = 15 cells, N = 4 scales for ROCKi. * = p < 0.05, ** = p <0.01. Two-way ANOVA followed by Bonferroni post-tests was used to determine significance between groups at each time point in (B). Mann-Whitney U tests were used to determine significance in (D-G). In (B), data points represent averages, error bars represent standard deviation. Timestamps in (A, C) denote mm:ss. Scale bars in (A, C) denote 10 microns.

