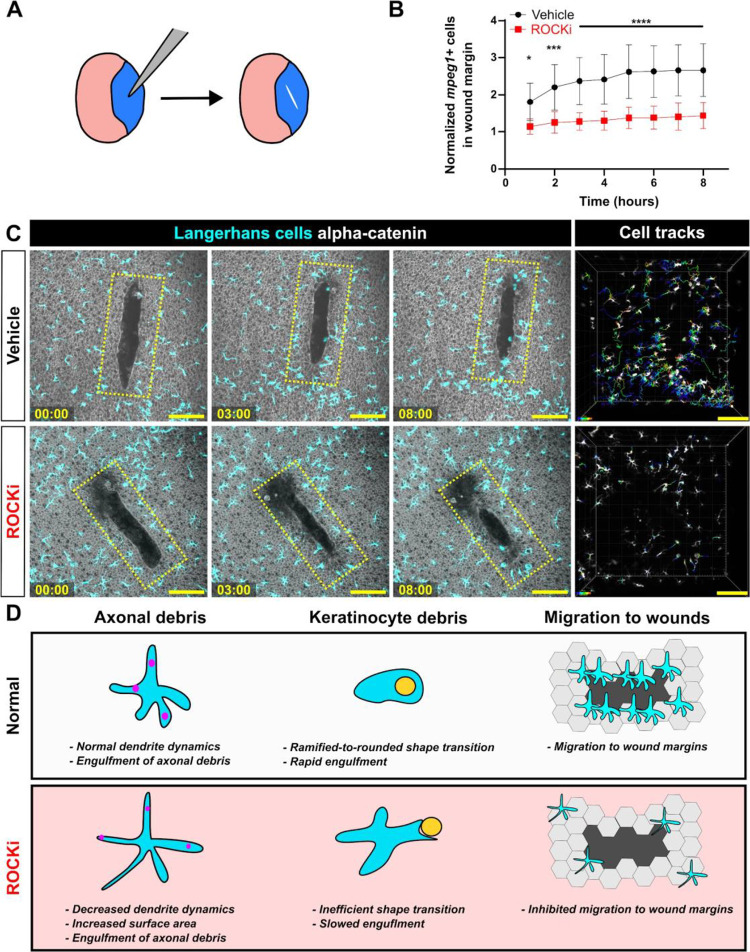
Figure 6. Effects of ROCK inhibition on Langerhans cell migration and graphical summary.
A. Experimental schematic of scale scratch assay. A mechanical injury damages a swath of epidermal cells. B. Quantification of number of mpeg1+ cells in wound margin, normalized to time of injury. n = 10 scales for vehicle, n = 12 scales for ROCKi. C. Still images of explanted scales expressing Tg(mpeg1:mCherry) and Gt(ctnna1-Citrine) depicting effects of vehicle treatment (top row) and ROCKi (bottom row). Yellow ROI denotes the wound margin used to quantify the number of mpeg1+ cells in (B). Cell tracking (rightmost panel) shows migratory tracks of vehicle- and ROCKi-treated cells color-coded according to time post-injury. D. Graphical summary of the effects of ROCK inhibition on Langerhans cell morphology, debris engulfment, and migration. * = p < 0.05, *** = p < 0.001, **** = p < 0.0001. Two-way ANOVA followed by Bonferroni post-tests was used to determine significance between groups at each time point in (B). In (B), data points represent averages, error bars represent standard deviation. Timestamps in (C) denote hh:mm. Scale bars in (C) denote 100 microns.

