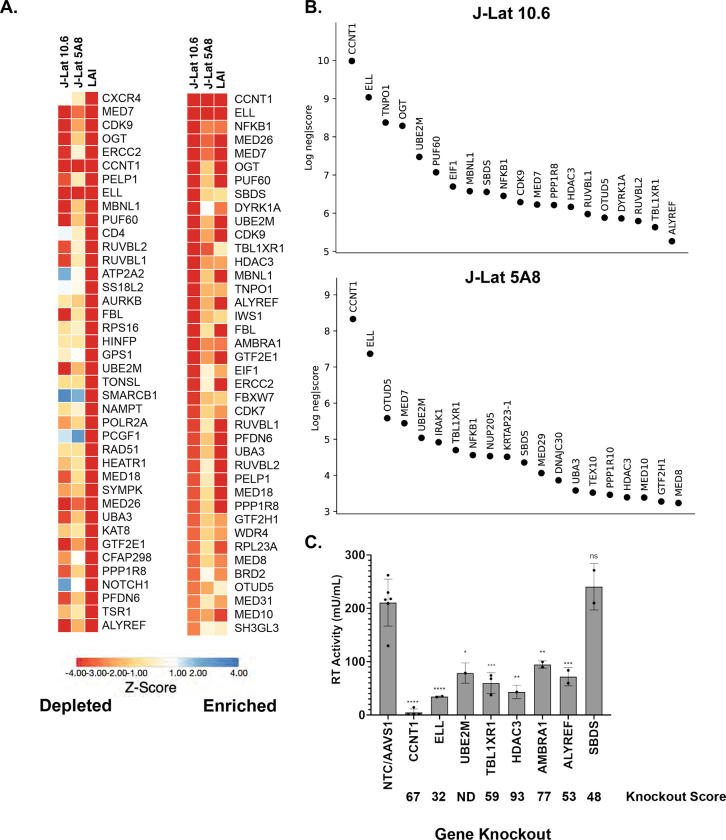
Figure 2. Analysis and Validation of Top Hits from HIV-CRISPR screen.
(A). Z-score analysis of the depleted versus enriched guides across multiple screens. J-Lat 10.6 and J-Lat 5A8 are screens from this study, whereas LAI represents Jurkat cells infected with an LAI strain of HIV-1 from previous screen performed using the same gene library in Jurkat cells to identify HIV Dependency Factors (17). Z-scores are sorted by the most depleted genes in the LAI screen (left panel) and by the most depleted genes in the J-Lat 10.6 line from this study (right panel). The mean z-score of two replicates each of J-Lat 10.6 and J-Lat 5A8, and of four replicates of the LAI screen is shown. Most depleted genes are red and most enriched genes are blue. Z-scores were that were less than −4 were capped at −4 in the heat map. (B). The top 20 most depleted hits from each J-Lat line in ranked order are shown. (C) Selected hits from the screen were tested by performing gene knockouts (x-axis), treating with the LRA combination AZD5582/I-BET151, and assayed for reverse transcriptase activity. Gene knockouts were performed using a lentiviral knockout approach and/or an electroporation with Cas9 and RNPs. Each point represents a single lentiviral or electroporation knockout experiment done in triplicate. An average of RT activity from two guides targeting each gene was taken for lentiviral knockouts, and the electroporation knockouts included three individual guides targeting each gene. The ICE gene knockout score for each experiment was averaged and is shown below each gene on the x-axis. Statistical analysis was performed using a two-way ANOVA and Šídák’s multiple comparisons test to measure the difference in latency reactivation between each gene knockout relative to NTC/AAVS1 control. p-value ≥ 0.05 = ns (not significant), < 0.05 = *, < 0.01 = **, < 0.001 = ***, < 0.0001 = ****. NTC/AAVS1 controls are combined; each dot represents either an AAVS1 or NTC control for an individual experiment. Each experiment (dot) has 3 technical replicates: NTC/AAVS1, n=6 experiments, 3 replicates each; CCNT1, n = 4 experiments, 3 replicates each; ELL, n = 2 experiments, 3 replicates each; UBE2M, n = 1 experiment, 3 replicates each; TBL1XR1, n = 3 experiments, 3 replicates each; HDAC3, 1 experiment, 3 replicates each; AMBRA1 n = 2 experiments, 3 replicates each; ALYREF, 2 experiments, 3 replicates each; SBDS n = 2 experiments, 3 replicates each.

