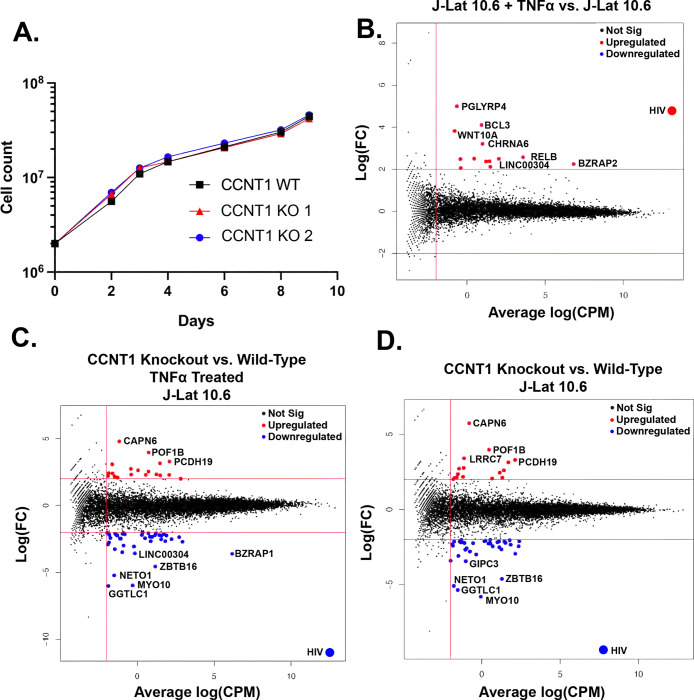
Figure 4. Cell proliferation and RNA sequencing analysis of CCNT1 knockouts in J-Lat 10.6 cells.
(A). Cell counts were monitored over a span of nine days in J-Lat 10.6 cells in WT or clonally knocked out CCNT1 cells. The average of three experimental replicates are shown with standard deviation. (B-D). Log2 FC (fold-change) is plotted on y-axis with the average Log2 CPM (counts per million) across technical replicates on the x-axis. Red lines on the signify genes that have an average Log2 CPM > −1, and a |Log2 FC | > 2. Red dots signify upregulated genes whereas blue genes signify downregulated genes for each comparison. B) Differential gene expression of J-Lat 10.6 with TNFα treatment versus J-Lat 10.6 (untreated) is shown. C). J-Lat 10.6 CCNT1 KO cells (two independent clones each tested in technical triplicate and averaged) versus the J-Lat 10.6 wild-type cells – both were treated with the LRA TNFα and gene expression comparison is shown. D). J-Lat 10.6 CCNT1 KO cells versus wild-type CCNT1 differential gene expression is shown – neither cell line was treated with an LRA.

