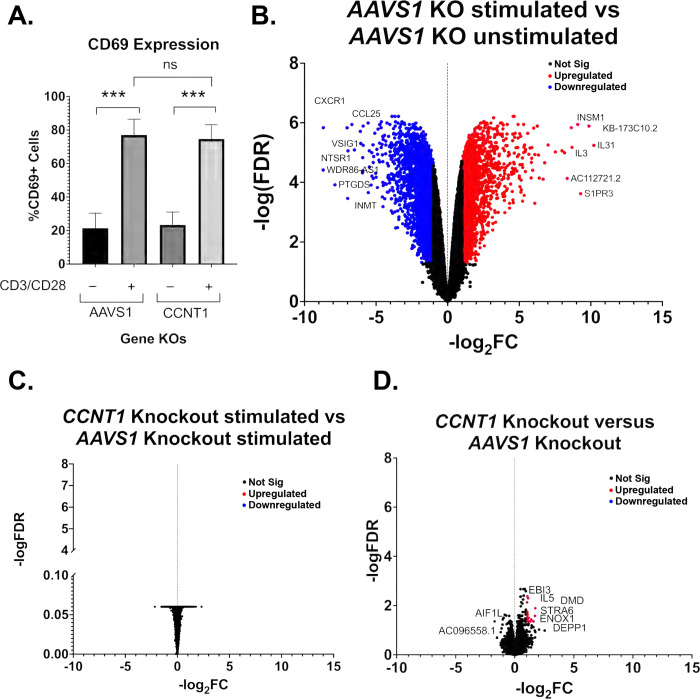
Figure 5. Primary T cells transcripts are largely unaffected by CCNT1 knockout.
(A) Uninfected CD4+ T cells from three donors were knocked out for AAVS1 or CCNT1, and then treated with CD3/CD28 co-stimulation. Cells were analyzed by flow cytometry to measure CD69 expression. On left, one representative donor is shown. On right, a summary of CD69 expression in AAVS1 knockout versus CCNT1 knockout from all three healthy donors is shown. One-way ANOVA was used for analysis with Dunnett’s multiple comparison tests. p (B-D). Volcano plots of primary CD4+ T cell RNA sequencing data is shown, with −log2FC shown on the x-axis and −log(FDR) on the y-axis. RNA was isolated from three biological replicates. A FDR = 0.05 was used as a cutoff for significance, and the cutoff for significant gene expression was |Fold-Change| > 1. A subset of genes for each condition are marked that have significance. (B) Differential gene expression between AAVS1 knockout stimulated with CD3/CD28 versus unstimulated is shown. (C) A comparison of CCNT1 versus AAVS1 knockout is shown, and both were stimulated with anti-CD3/anti-CD28 antibodies. (D) CCNT1 versus AAVS1 knockout is shown, and neither of these are stimulated with anti-CD3/anti-CD28 antibodies. p-value ≥ 0.05 =, < 0.001 = ***

