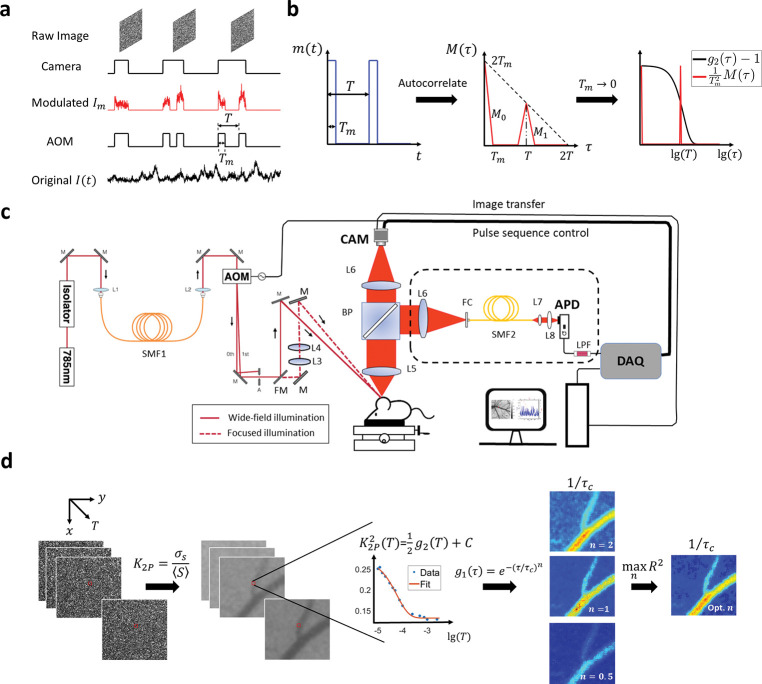
Figure 1:
Overview of the methodology and instrumentation. a Temporal relationship between intensity modulation and camera exposure. The x-axis is time. AOM: acoustic optical modulator. The sample is illuminated only when AOM modulation voltage is high. Hence for , only the signal when AOM is high will be recorded and integrated onto the camera raw image. : the period of the two-pulse modulation waveform. : pulse duration. b The autocorrelation function of 2-pulse modulation waveform. : intensity modulation waveform. . : the autocorrelation of . consists of two pulses denoted as and . When is approaching 0, becomes the sum of two delta functions. c Diagram of the instrumentation of this study. Two illumination light paths are constructed: widefield (real line) and focused (dashed line). The light is switched between the two paths by a flip mirror but modulated by the same pulse sequence. The back-scattered light is collected by the objective and then split by a 50/50 beamsplitter. The two splits are collected by camera and APD, respectively. AOM: acoustic optical modulator. BP: 50/50 beamsplitter plate. APD: avalanche photon diode. DAQ: data acquisition board. CAM: camera. L: lens. M: mirror. FM: flip mirror. FC: fiber coupler. SMF: single-mode fiber. LPF: low-pass filter. d The workflow of extracting correlation time from 2-pulse modulated multiple-exposure raw images. The 2-pulse modulated speckl contrast, , is first computed from the modulated raw speckle images and its trace along the third dimension is then fitted with different electric field correlation models . The best model is identified by maximizing the coefficient of determination, . lg: logarithm to base 10.

