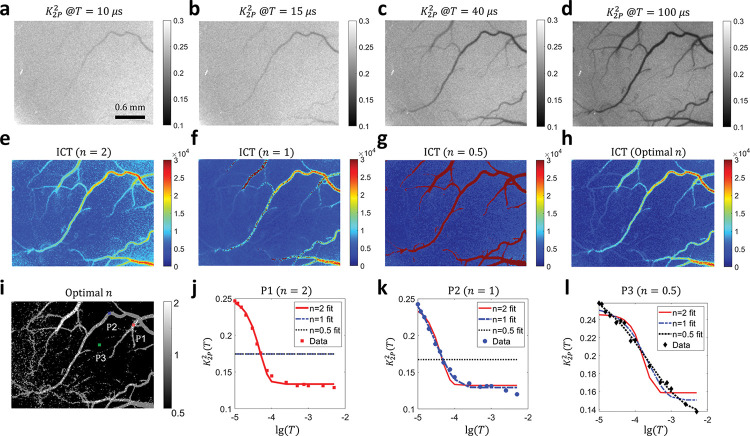
Figure 4:
2-pulse illumination modulation across the entire field of view enables wide-field quasi measurement and correlation time mapping. a-d The quasi , i.e. images at and , respectively. Image size: 1000×750. e-f ICT maps extracted with three models. and 0.5, respectively. . The 2D map of correlation times was obtained by fitting maps at 15 time points ranging from to 5 ms. h ICT map with optimized at each pixel to maximize the , the coefficient of determination. i Map of optimal . j-l Fitting results of at the three points highlighted in i. lg: logarithm to base 10. In figure j, the and models fail to fit the curve. Hence, they appear as a flat line in the plot. The same is true for the model in figure k.

