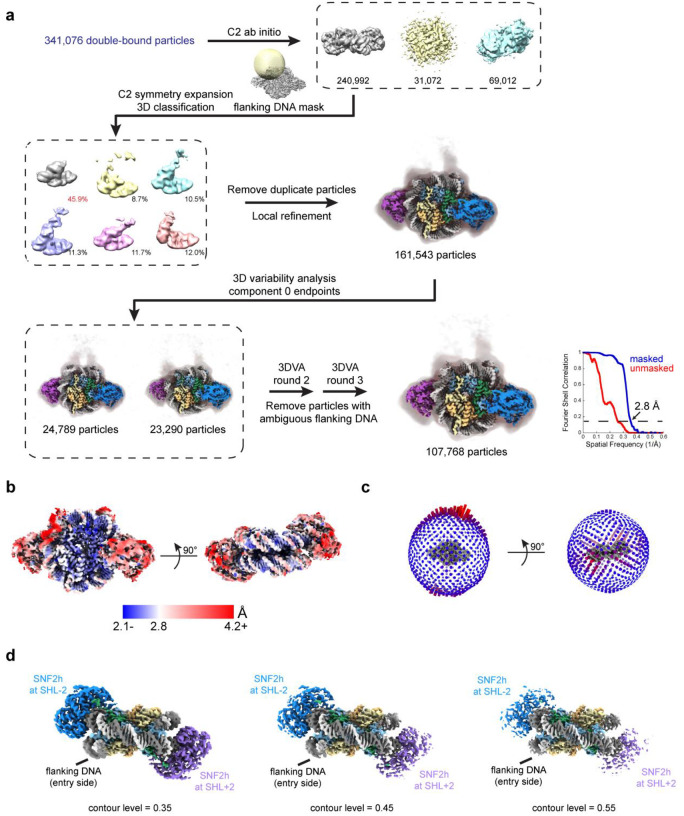
Extended Data Fig. 4. Classification for double-bound SNF2h-nucleosome complexes.
a) Schematic illustrating processing workflow to identify the location of flanking DNA for the double-bound SNF2h-nucleosome complex as described in Methods. The gold-standard FSC determined by cryoSPARC is plotted in blue (FSC threshold of 0.143 indicated with dotted line).
b) The double-bound SNF2h-nucleosome map surface colored by local resolution determined by cryoSPARC with FSC cutoff of 0.143.
c) Angular distribution plots for the double-bound SNF2h-nucleosome map.
d) Coulomb potential map of the double-bound SNF2h-nucleosome complex shown at different contour levels. As the contour level increases, the density for SNF2h at the SHL+2 position appears weaker than the density for SNF2h at the SHL-2 position.

