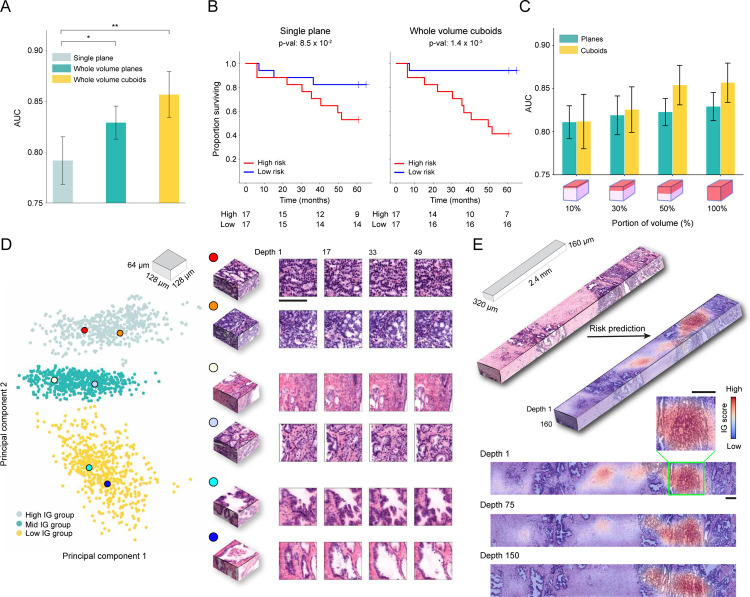
Figure 2: MAMBA analysis of open-top light-sheet microscopy (OTLS) prostate cancer cohort.
The OTLS cohort contains volumetric tissue images (1μm/voxel resolution) of simulated core needle biopsies extracted from prostatectomy specimens. (A) Cohort-level AUC for MAMBA trained and tested on the top plane from each volume (single plane), all planes and cuboids within the whole volume (whole volume planes and whole volume cuboids, respectively), repeated over five different experiments. Results for balanced accuracy and F1-score metrics can be found in Extended Data Figure 2B. Statistical significance was assessed with an unpaired t-test. *P ≤ 0.05 and **P ≤ 0.01. (B) Kaplan-Meier survival analysis for patients with BCR timestamps available, stratified at 50 percentile based on MAMBA-predicted risk, for single plane and whole volume cuboids approaches. The log-rank test was used. (C) Ablation analysis with training and testing on increasing portions from the top of each volume. (D) Principal component feature space plot for 3D patches with high (unfavorable outcome), middle (no influence), and low (favorable outcome) 10% integrated gradient (IG) scores aggregated across the entire cohort. Representative 3D patches and 2D slices within the patch are displayed for each cluster. (E) 3D IG heatmap with representative 2D planes displaying unfavorable (red) and favorable (blue) prognostic regions. Additional examples of IG heatmaps can be found in Extended Data Figure 3. All scale bars are 100μm.

