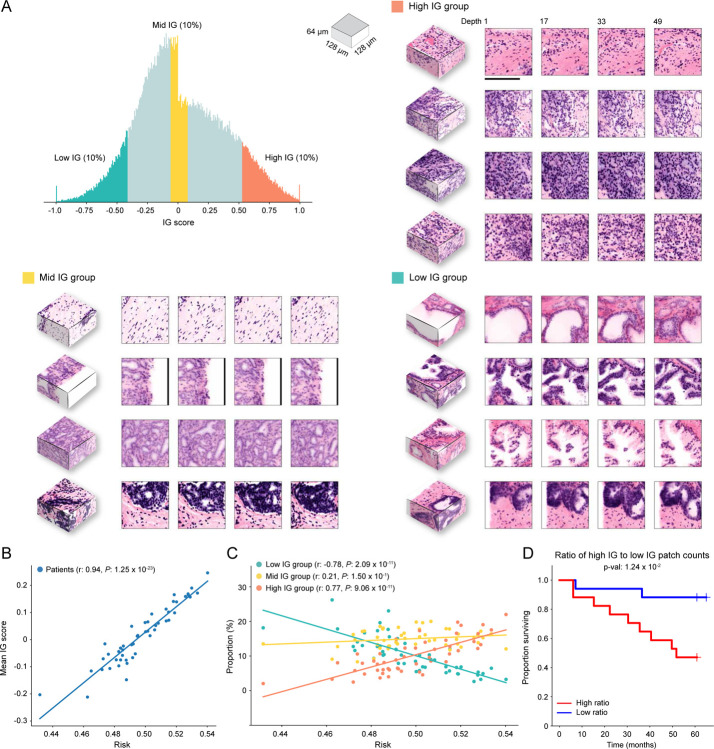
Extended Data Figure 4: Integrated gradient analysis for open-top light-sheet microscopy (OTLS) dataset.
(A) Patches from the high IG cluster exhibit infiltrative carcinoma that resembles predominantly poorly-differentiated glands (Gleason pattern 4), exhibiting cribriform architecture. Patches from the middle IG cluster exhibit infiltrative carcinoma that resembles mixtures of Gleason patterns 3 and 4. Patches from the low IG cluster predominantly exhibit large, benign glands, with occasional corpora amylacaea. (B) Scatter plot of the normalized IG patch scores averaged within each sample as a function of predicted risk (the predicted probability for the high-risk group). (C) The scatter plot of the proportion of the number of high, middle, and low IG group patches in each sample as a function of predicted risk, which shows that a sample with a higher predicted risk profile has a larger (smaller) fraction of high (low) IG patches. (D) Kaplan-Meier curve for the cohort stratified (50%) by the ratio of the number of patches in the high and low IG group. The good stratification performance suggests that the extent to which prognostic morphologies manifest in each sample is also important. The scale bar is 100μm.

