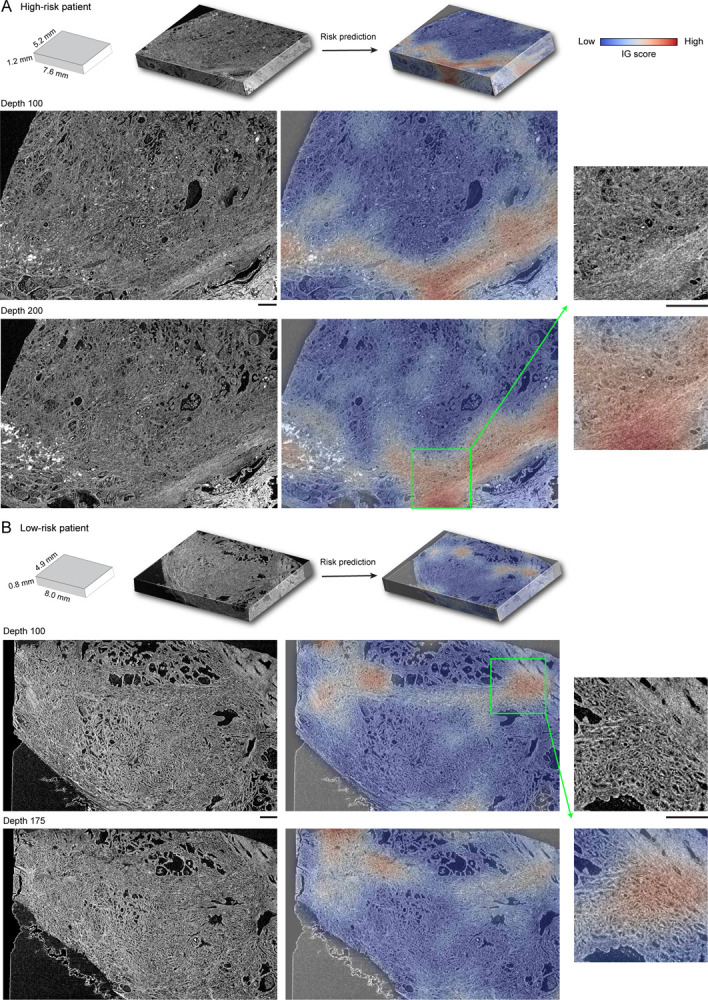
Extended Data Figure 5: Integrated gradient (IG) heatmaps for the microcomputed tomography (microCT) cohort.

The integrated gradient scores are assigned to each patch with high IG (low IG) patch indicating that patch contributes to unfavorable (favorable) prognosis. (A) In this high-risk sample, high IG values are localized in areas with the smallest and densest cancerous glands, especially when they are in or adjacent to the capsule of the prostate, as well as dense stroma that resembles the prostate capsule. (B) Similar to the high-risk case, high IG regions in this low-risk sample correspond to areas with small, dense cancerous glands and dense stroma. The juxtaposition of these two morphologies has particularly high IG values. All scale bars are 500μm. The heatmaps can also be visualized in our interactive demo.
