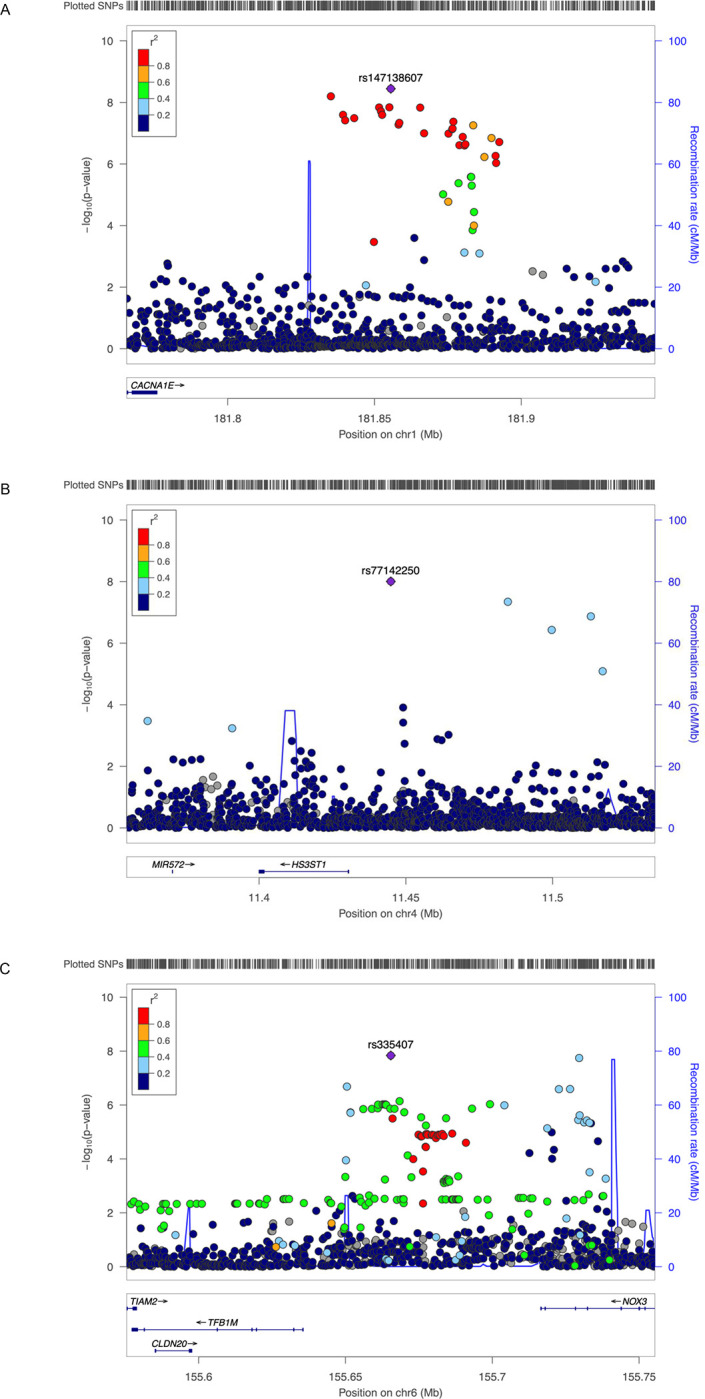
Figure 2. Regional association plots for the three genome-wide significant variants.

A, rs147138607 near CACNA1E and ZNF648. B, rs77142250 near HS3ST1. C, rs335407 near TFB1M and NOX3. The hash marks above the panel represent the position of each SNP that was genotyped or imputed. The negative log10 of P values from the Cox regression are shown in the y-axis. Estimated recombination rates are plotted to reflect recombination hot spots. The SNPs in LD with the most significant SNP are color coded to represent their strength of LD based on Europeans for A, and C, and Africans for B.
