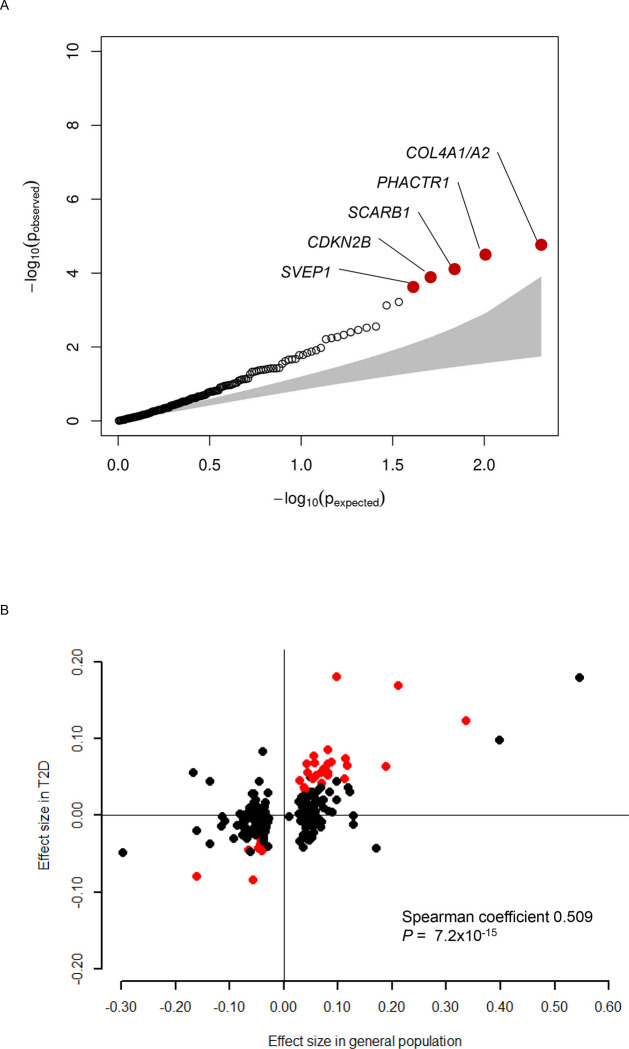
Figure 3. Association of previously identified 204 CAD variants with incident CVD in people with T2D.
A, QQ plot showing the distribution of the observed P values for the 204 CAD variants with risk of incident CVD in people with T2D against the expected distribution under the null hypothesis. The red dots highlight five variants that were significantly associated with incident CVD after Bonferroni correction. B, Comparison of the effect size of known 204 CAD variants in the general population and incident CVD in people with T2D. Effect size of the known 204 CAD variants for prevalent CAD in the general population (x-axis, β-coefficient from logistic regression analysis) and incident CVD in people with T2D (y-axis, β-coefficient from Cox regression analysis) are plotted. There was a significant correlation between the effect sizes (Spearman coefficient 0.509, P=7.2×10⁻¹⁵). The red dots highlight 32 variants that were nominally (P<0.05) associated with incident CVD and had same direction of association in the general population.

