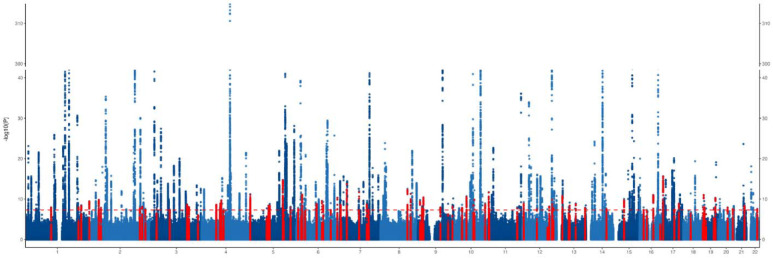
Figure 2. Manhattan plot of the results from atrial fibrillation GWAS meta-analysis.
Each point represents a genetic variant. Genetic variants against the log-transformed P value of the associations with AF in the GWAS meta-analysis. Genetic variants in red represent variants located +/−500 kb of a novel genome-wide significant locus.

