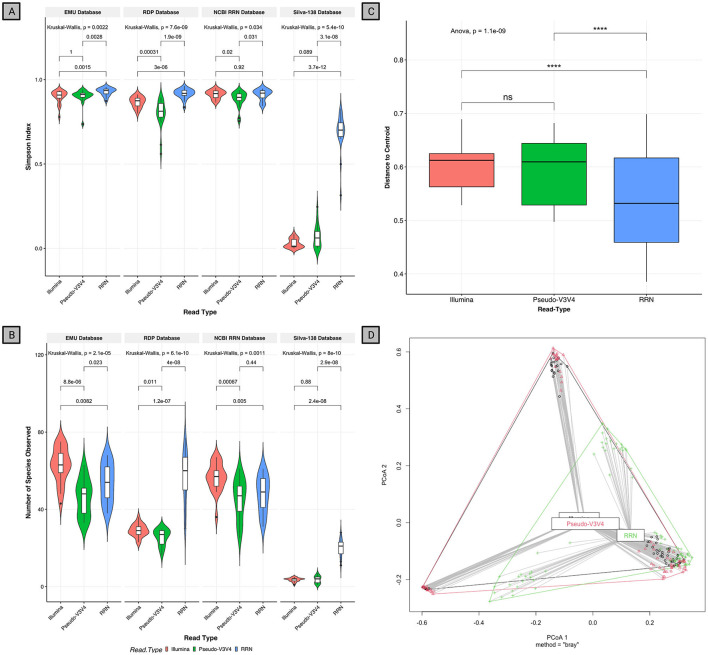
Figure 4.
Alpha- and beta-diversity measures of the R10.4 rrn Illumina comparison. (A) Alpha diversity by the measure of Simpson Evenness and (B) Observed richness. The database is faceted on top of each read grouping by database while the sequence type can be seen as red (Illumina), green (Pseudo-V3V4), and blue (RRN). Kruskal–Wallis and pairwise chi-squared were done and p.adj is shown. (C) Beta-dispersion metrics of distance to the centroid. Sprawl between sample centers can be seen on the y-axis while each sequence type is plotted separately on the x-axis. Non-parametric ANOVA and pairwise t-test are shown here. (D) Beta-dispersion PCoA by Bray–Curtis distance matrix. Each sequence type can be seen as a distinct shape or by color: Illumina (black), Pseudo-V3V4 (red), and RRN (green).

