
Figure 1:
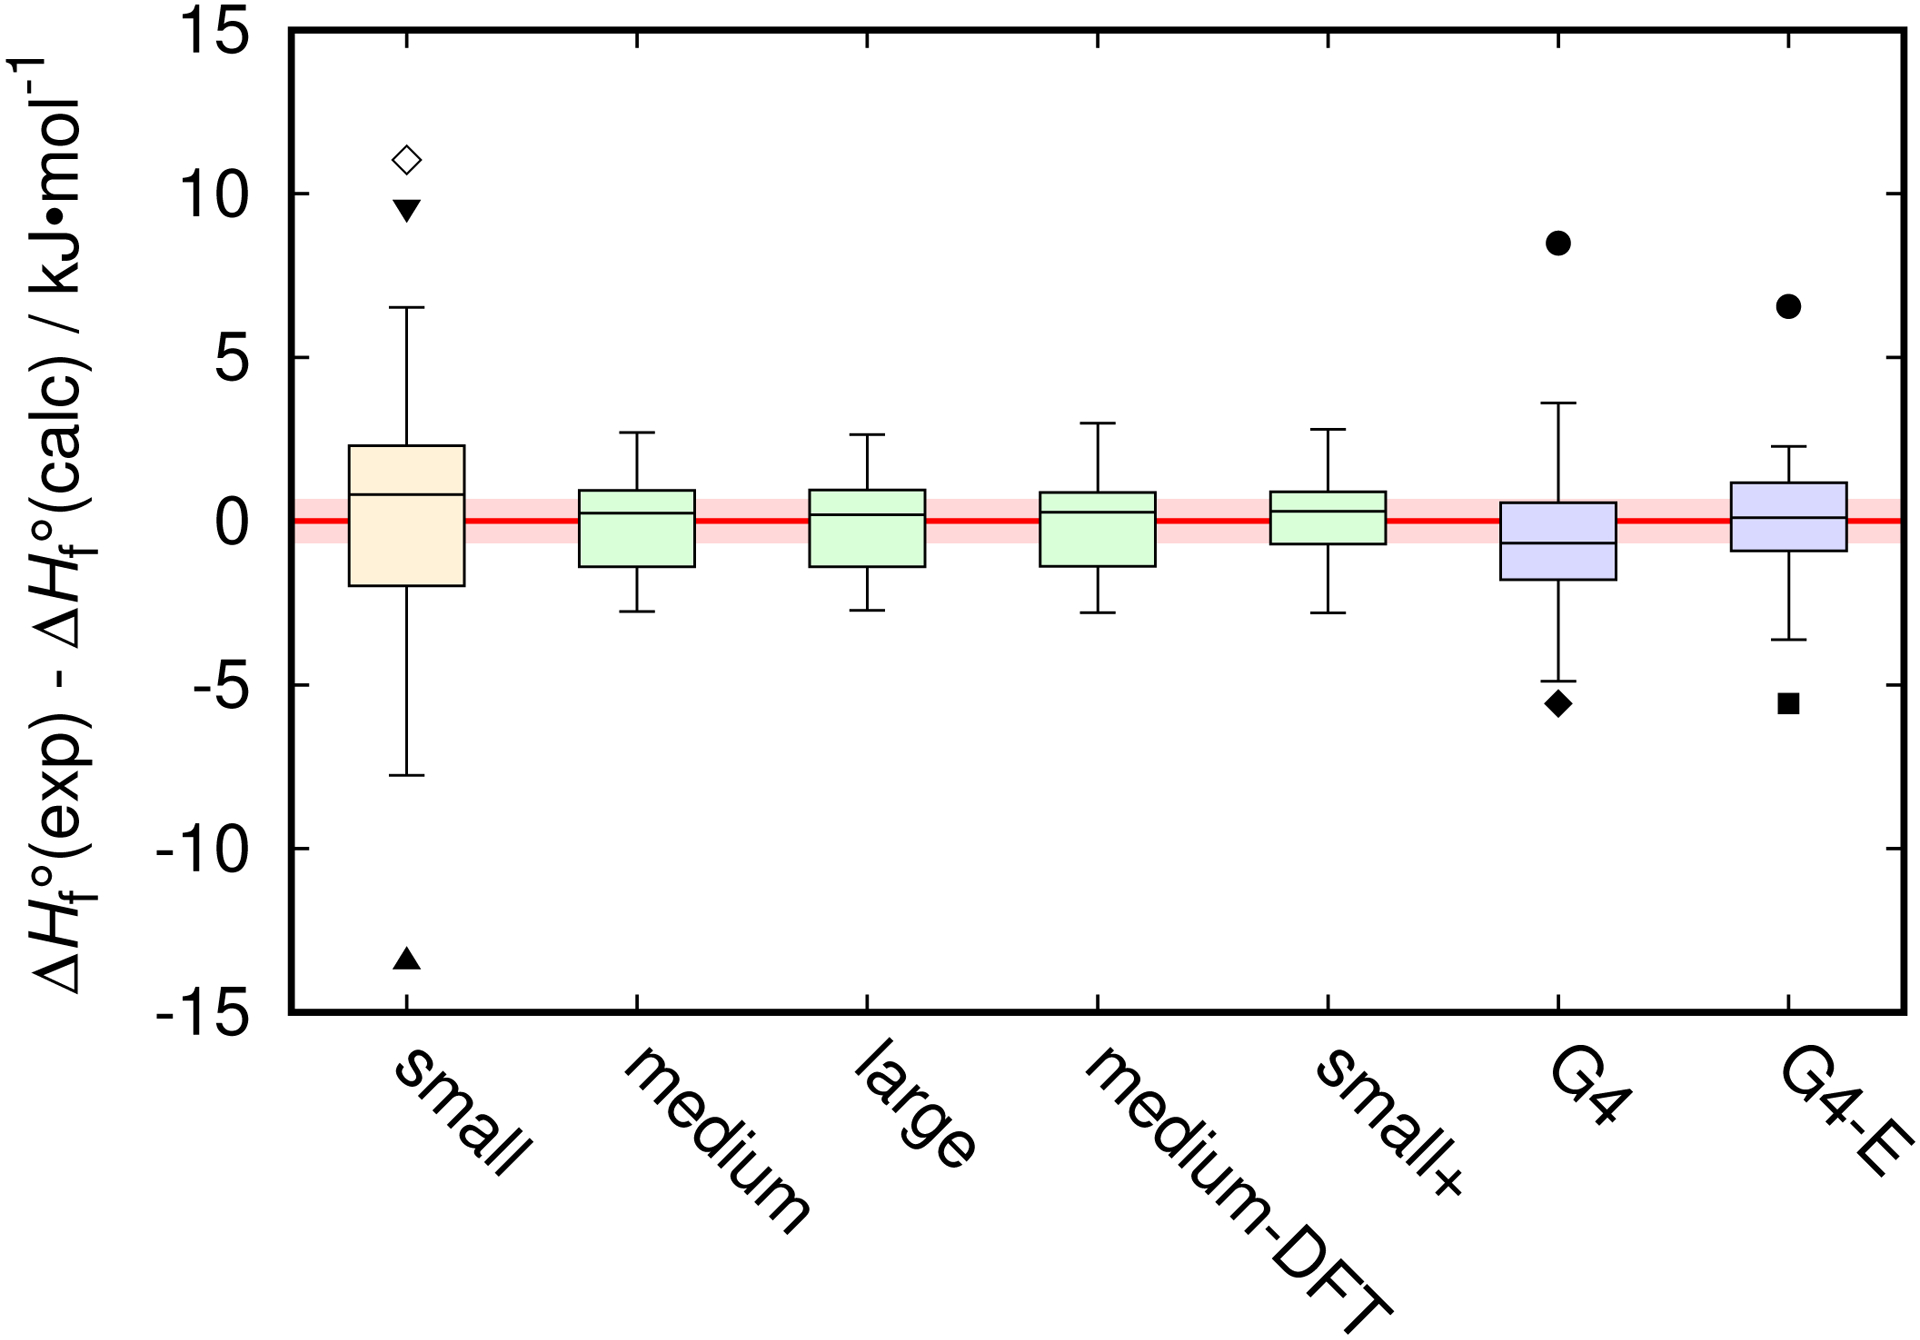
Box-and-whisker diagram of the deviations between the experimental and computed ΔfH○. Whiskers indicate data extrema within 1.5 of the interquartile range from the corresponding box edges.113 The outliers: ● - nitrobenzene, ◆ - urea, ■ - phenol, ▴ - water, ▾ - carbon dioxide, ◇ - acetonitrile. The shaded area represents a 50 % confidence interval (consistent with the box sizes) for the state-of-the-art calorimetric measurements corresponding to 0.95 confidence level of 2 kJ·mol−1.