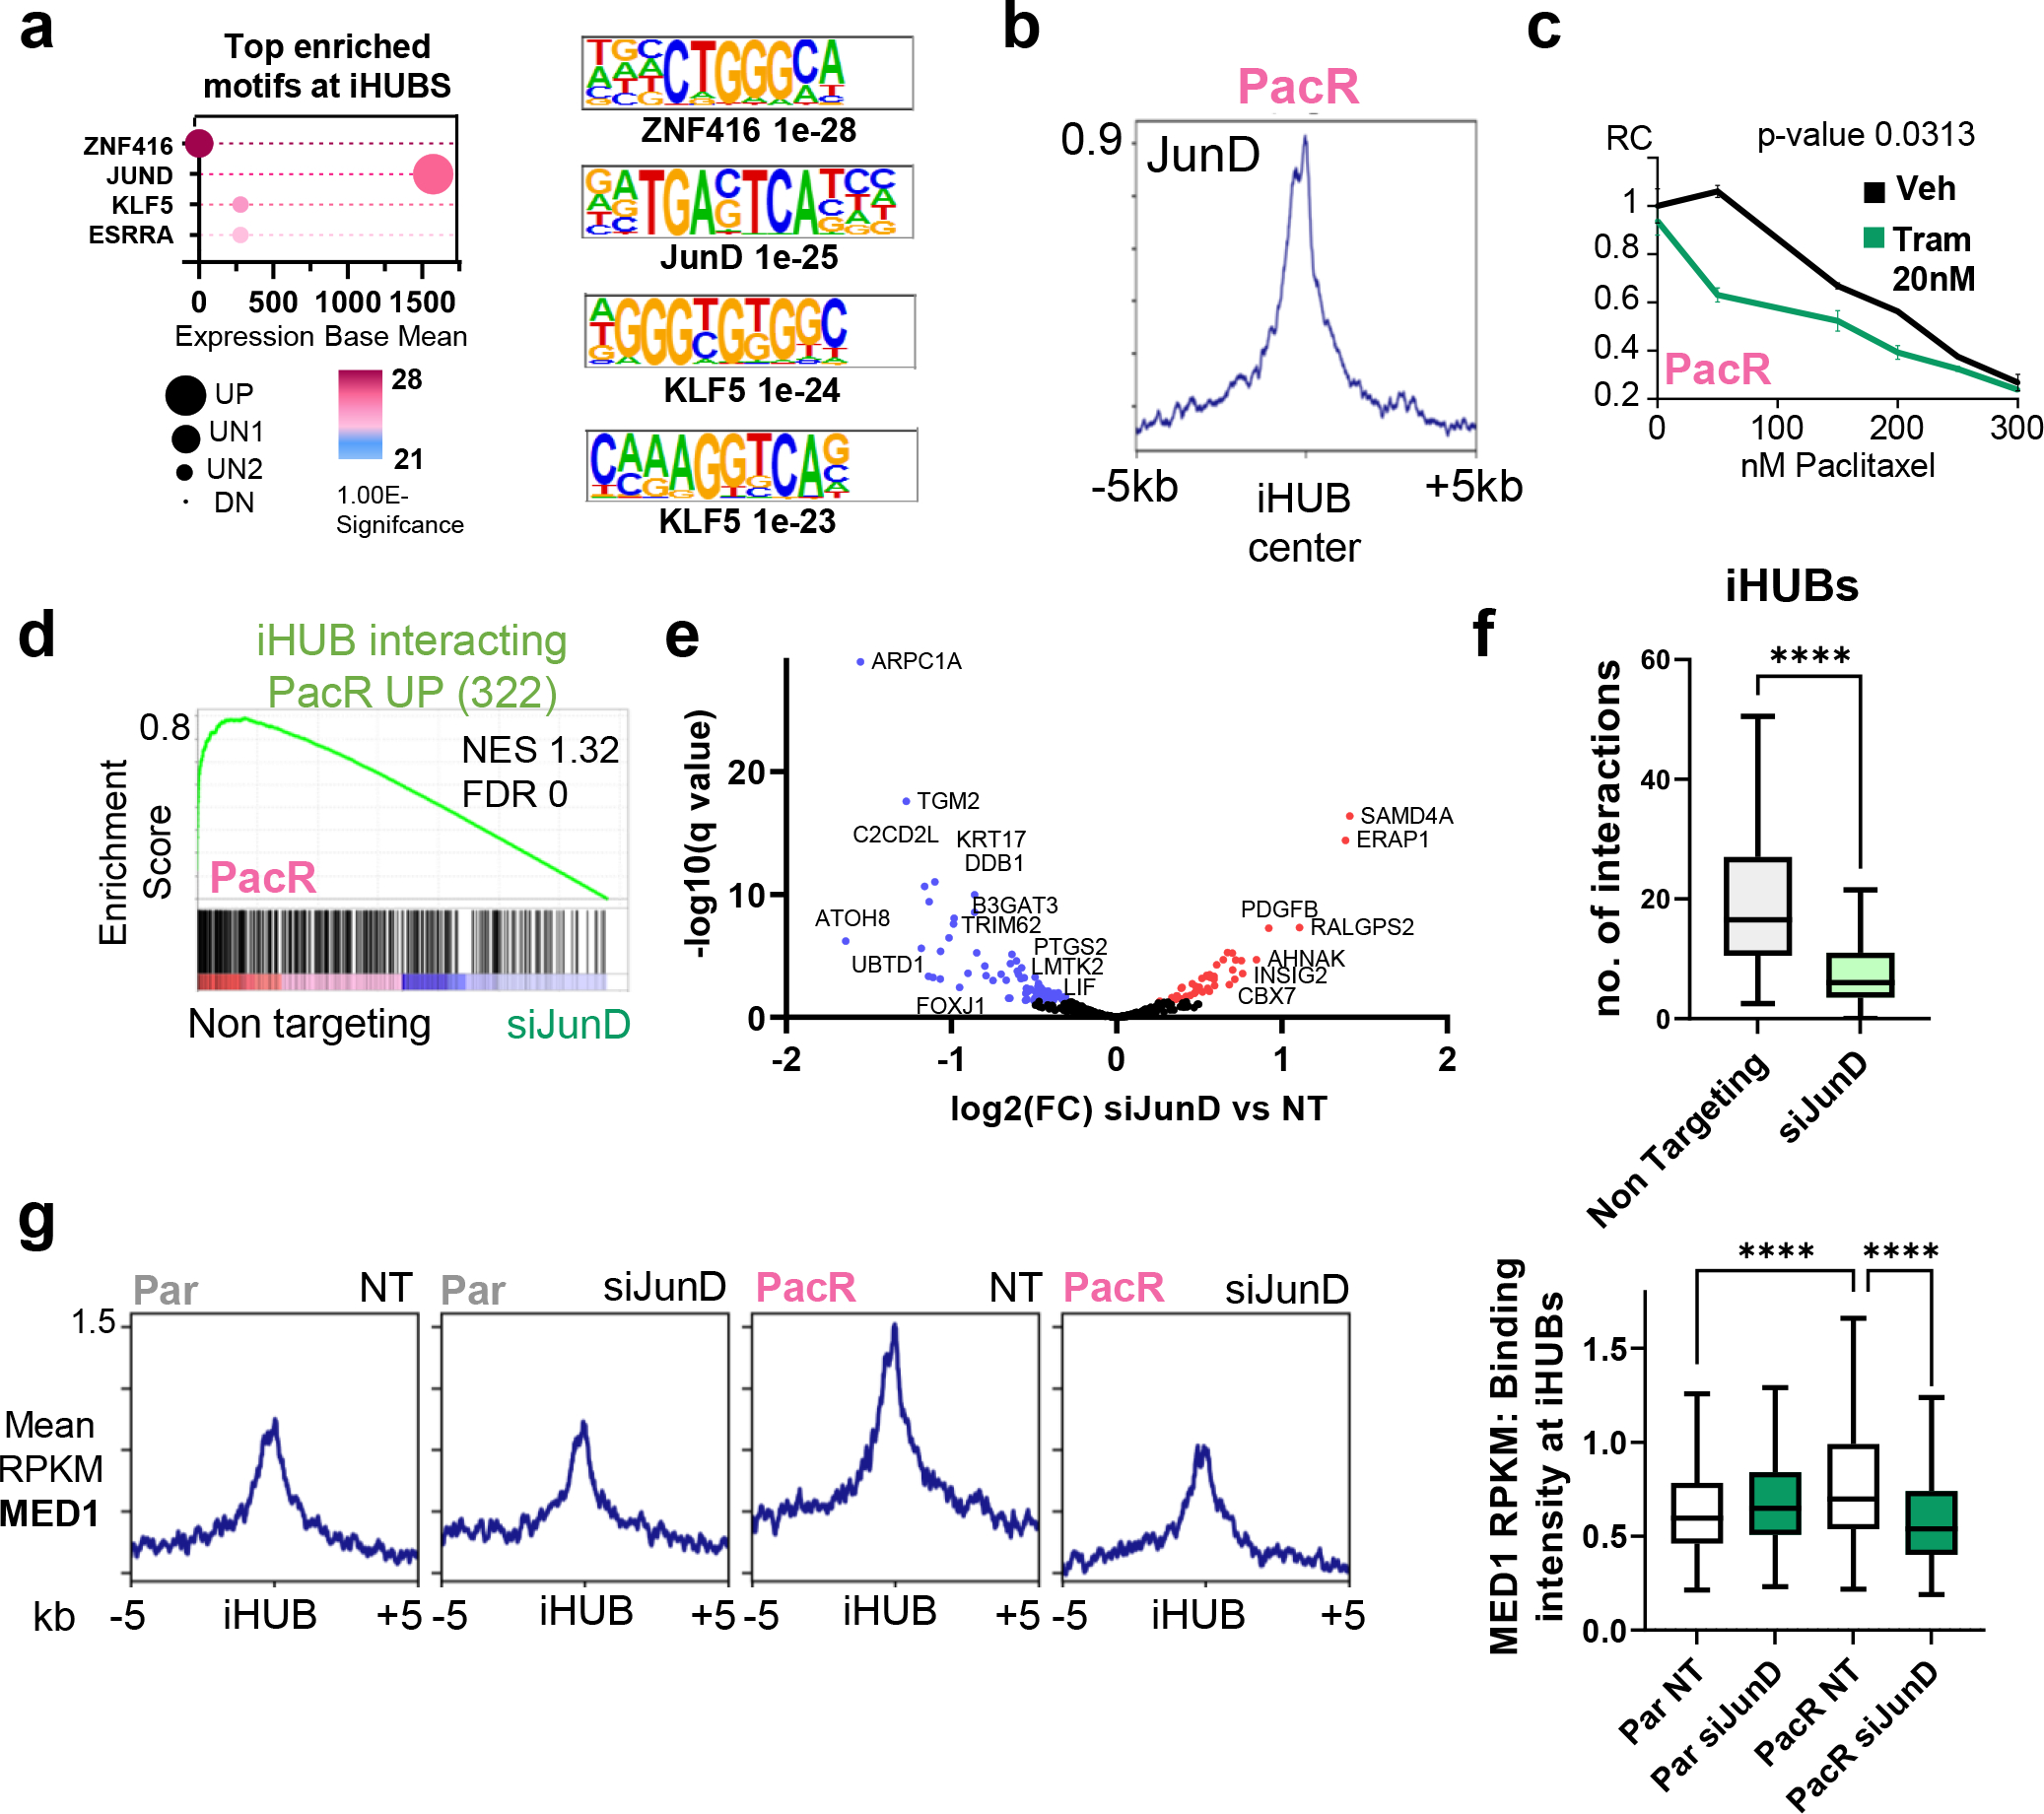
Fig. 4. JunD drives iHUB formation in chemoresistance in PDAC.

(a) Cleveland plot depicting the top motifs enriched at iHUBs (defined by HOMER) coupled with expression base mean and regulation patterns in PacR compared to Par. JunD is the top hit for transcription factors that are enriched at iHUBs. JunD is expressed and upregulated in PacR compared to Par. (b) Binding profile for JunD in PacR cells at iHUB regions [peaks center is the ATAC summit; extended for −/+5kb]. (c) Relative showing significant sensitization upon treatment with low concentrations of the trametinib when combined with paclitaxel. (d) Gene set enrichment analysis for iHUB interacting activated genes in PacR (322 genes) in PacR with JunD knockdown (24 hours) compared to Non targeting. Plot shows a significant downregulation of iHUB activated PacR genes in JunD knockdown. (e) Volcano plot for differentially regulated genes upon JunD knockdown in PacR cells. [Blue: significantly downregulated, Red: significantly upregulated]. Notably, GPX4 is not significantly downregulated. (f) Box plot showing number of interactions at IHUBs in PacR when comparing non-targeting to JunD knockdown. It shows a significant decrease in the number of iHUB interactions upon JunD depletion. (g) Plot Profile and box plots showing localization intensity of Med1 at iHUB regions. Plots show a significant upregulation of Med1 enrichment in PacR cells compared to Par cells and a significant downregulation of Med1 enrichment upon JunD knockdown.
