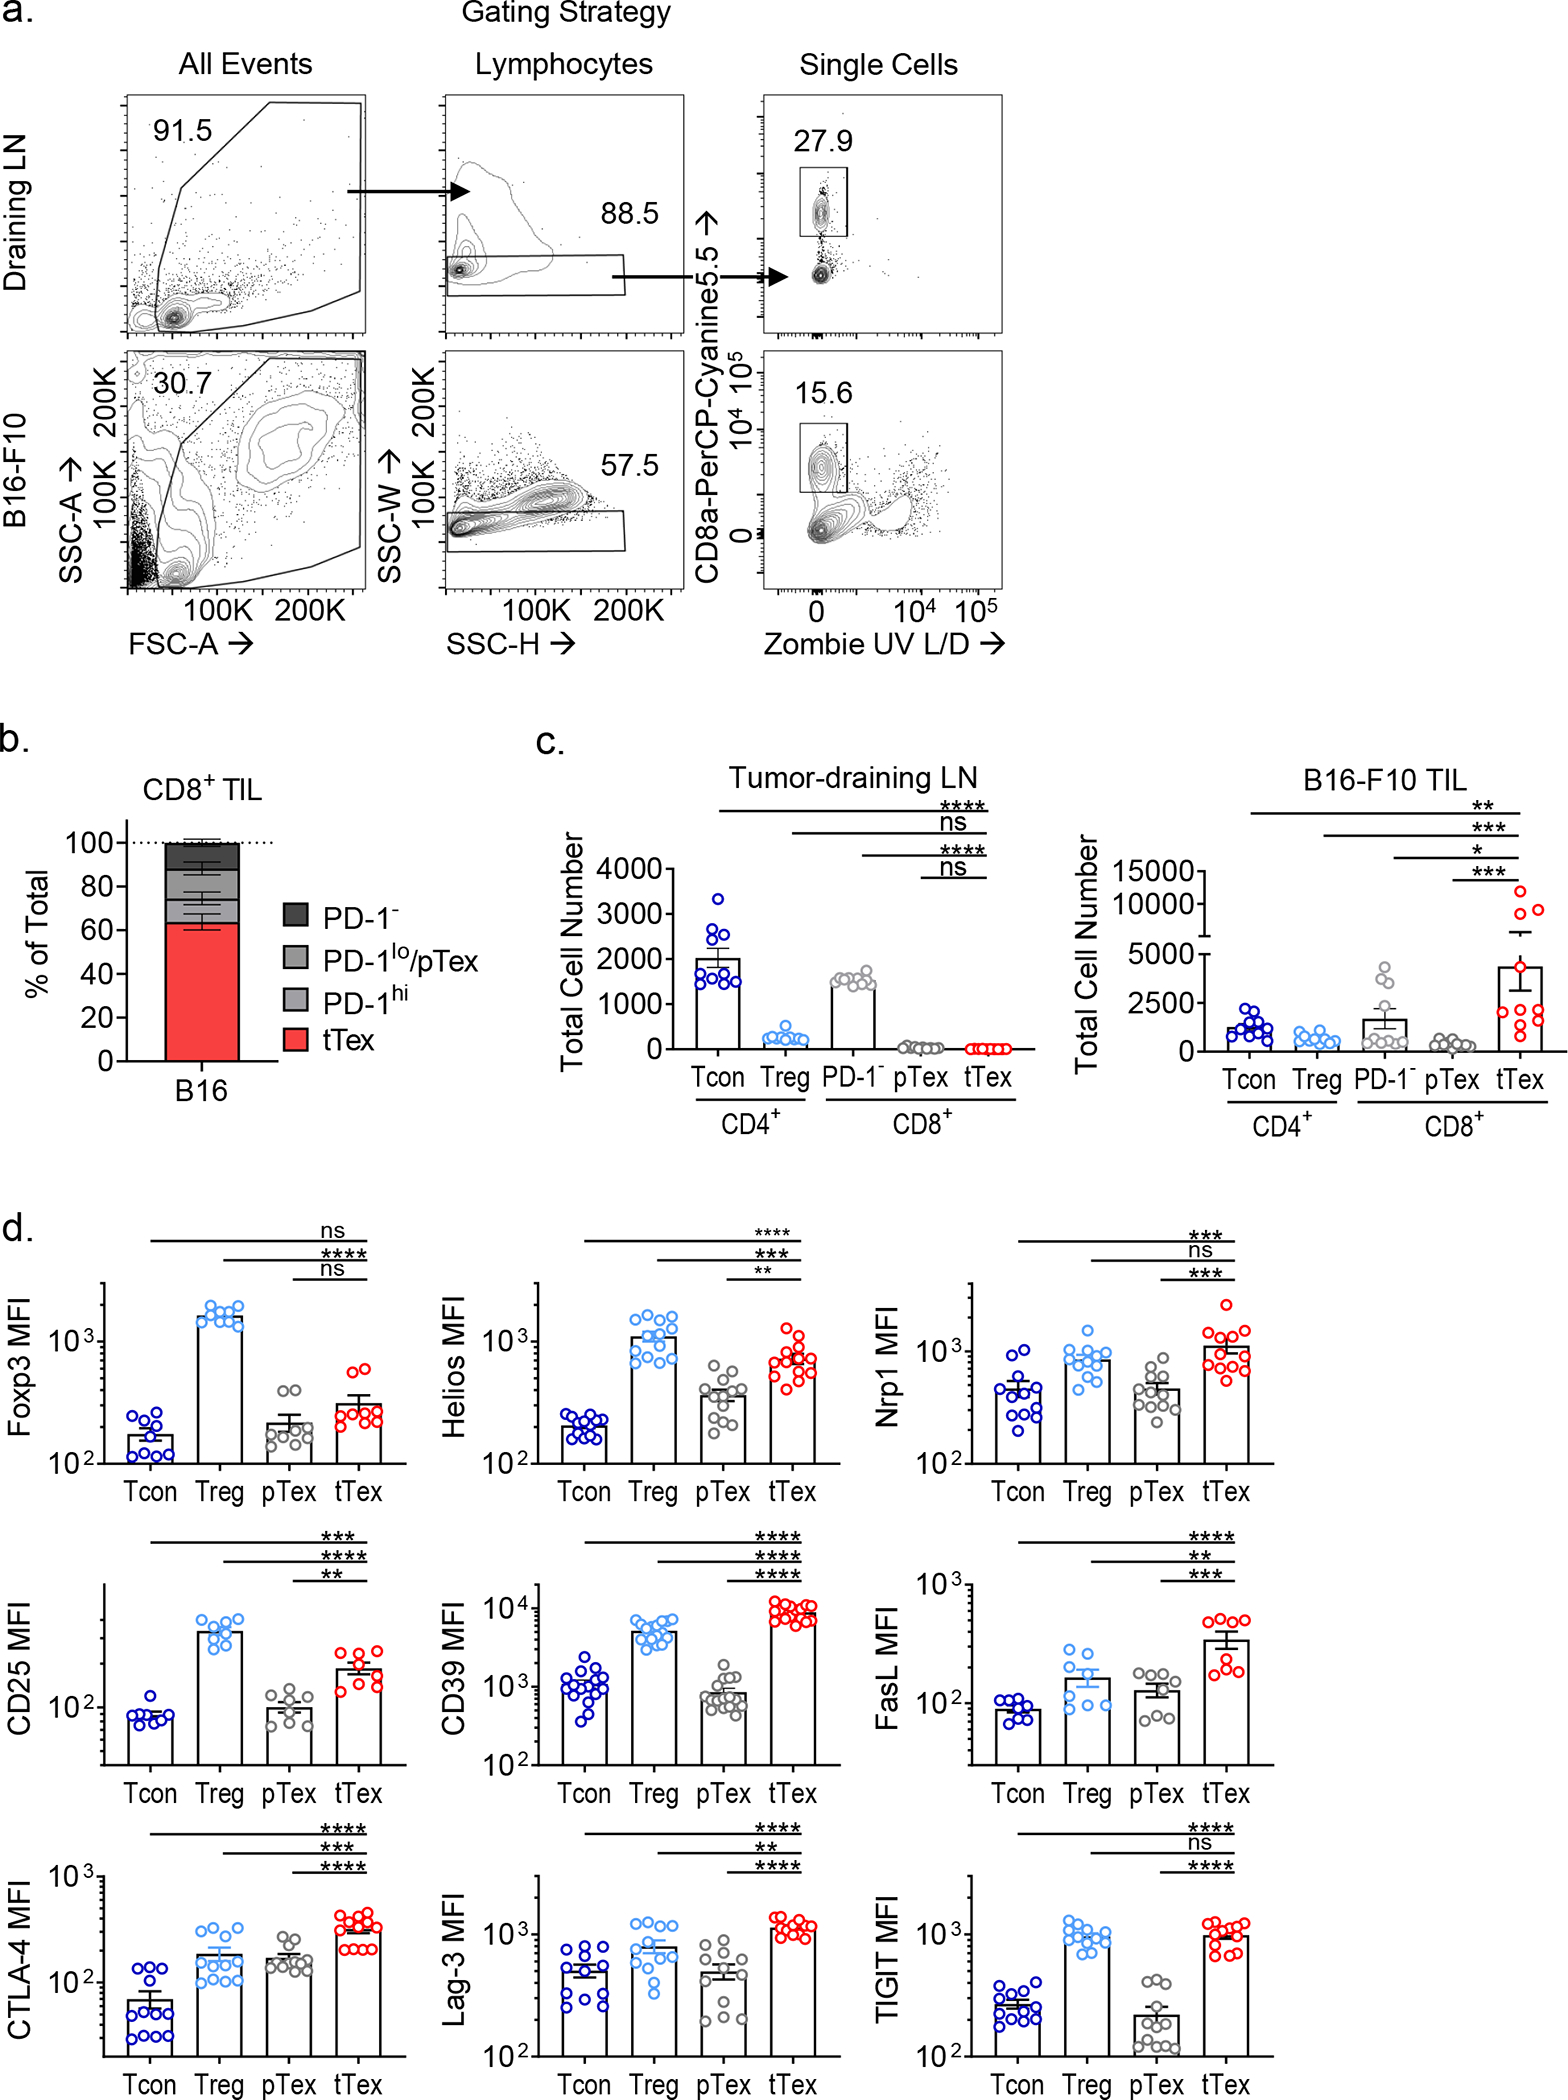
Extended Data Figure 1. PD-1hiTim-3+ terminally exhausted CD8+ T cells are a numerically dominant in tumor and express numerous Treg cell-associated effector molecules.

(A) Gating strategy for isolating CD8+ T cells in B16-F10 tumor or tumor-draining lymph nodes. (B) Quantified distribution of inhibitory receptor expression on CD8+ TIL from Fig. 1A. (C) Total cell numbers per size-matched B16-F10 tumor or draining lymph node. (D) Quantification from Fig. 1C. Mean fluorescence intensity (MFI) of CD4+Foxp3+ Treg cell-associated genes among tumor infiltrating T cell populations. Statistics are one-way ANOVA (C,D) with *p<0.05, **p<0.01, ***p<0.001 and ****p<0.0001
