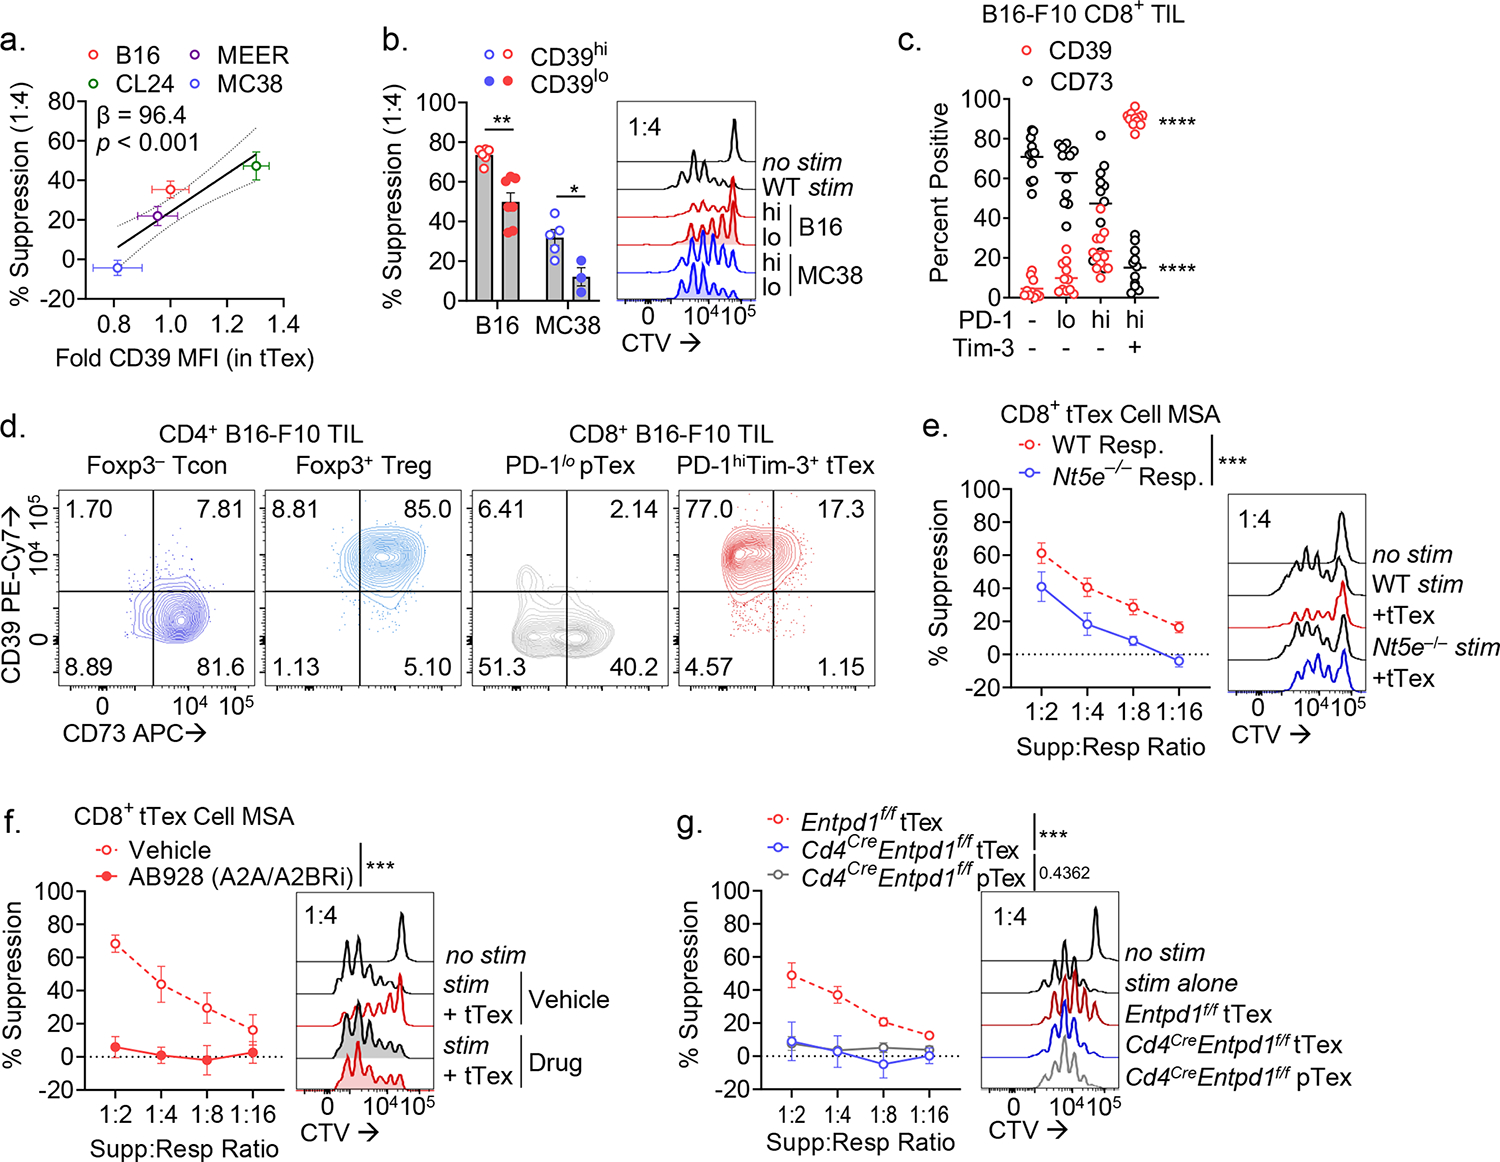
Figure 4. tTex cells suppress through CD39-mediated extracellular ATP depletion and adenosine production.

(A) Pearson correlation of percent tTex cell-mediated suppression cell in 1:4 ratio in suppression assay versus fold change in CD39 MFI in tTex cells between murine tumor lines. (B) Repeat experiments from Fig. 1G and 2F, in which tTex cells from B16-F10 and MC38 tumors were stratified by CD39 expression. (C) Percent CD8+ T cell populations from B16-F10 expressing CD39 or CD73. (D) Representative bivariant plots of B16-F10 infiltrating T cell populations. (E) Suppression assay of B16-F10 TIL co-cultured with with activated CTV-labeled C57/BL or Nt5e– ‘responding’ T cells. (F) Suppression assay of B16-F10 infiltrating CD8+ tTex cells co-cultured with DMSO vehicle or A2AR/A2BR small-molecule inhibitor AB928 at 3 μg/mL. (F) MSA of B16-F10 TIL from Entpd1f/f or Cd4CreEntpd1f/f mice. Statistics are linear regression (A,E-G) and one-way ANOVA (B,C) with *p<0.05, **p<0.01, ***p<0.001 and ****p<0.0001.
