
FIGURE 3.
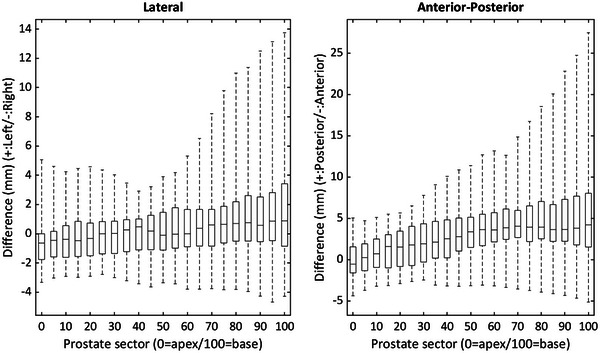
Box plot of the differences between urethral positions at each prostate sector. The plot shows median value, limits of 25% and 75% quartiles, and range of each value.
Official websites use .gov
A
.gov website belongs to an official
government organization in the United States.
Secure .gov websites use HTTPS
A lock (
) or https:// means you've safely
connected to the .gov website. Share sensitive
information only on official, secure websites.
Box plot of the differences between urethral positions at each prostate sector. The plot shows median value, limits of 25% and 75% quartiles, and range of each value.