
Figure 2. . Unadjusted and adjusted (ATT weighted) Kaplan–Meier plots.
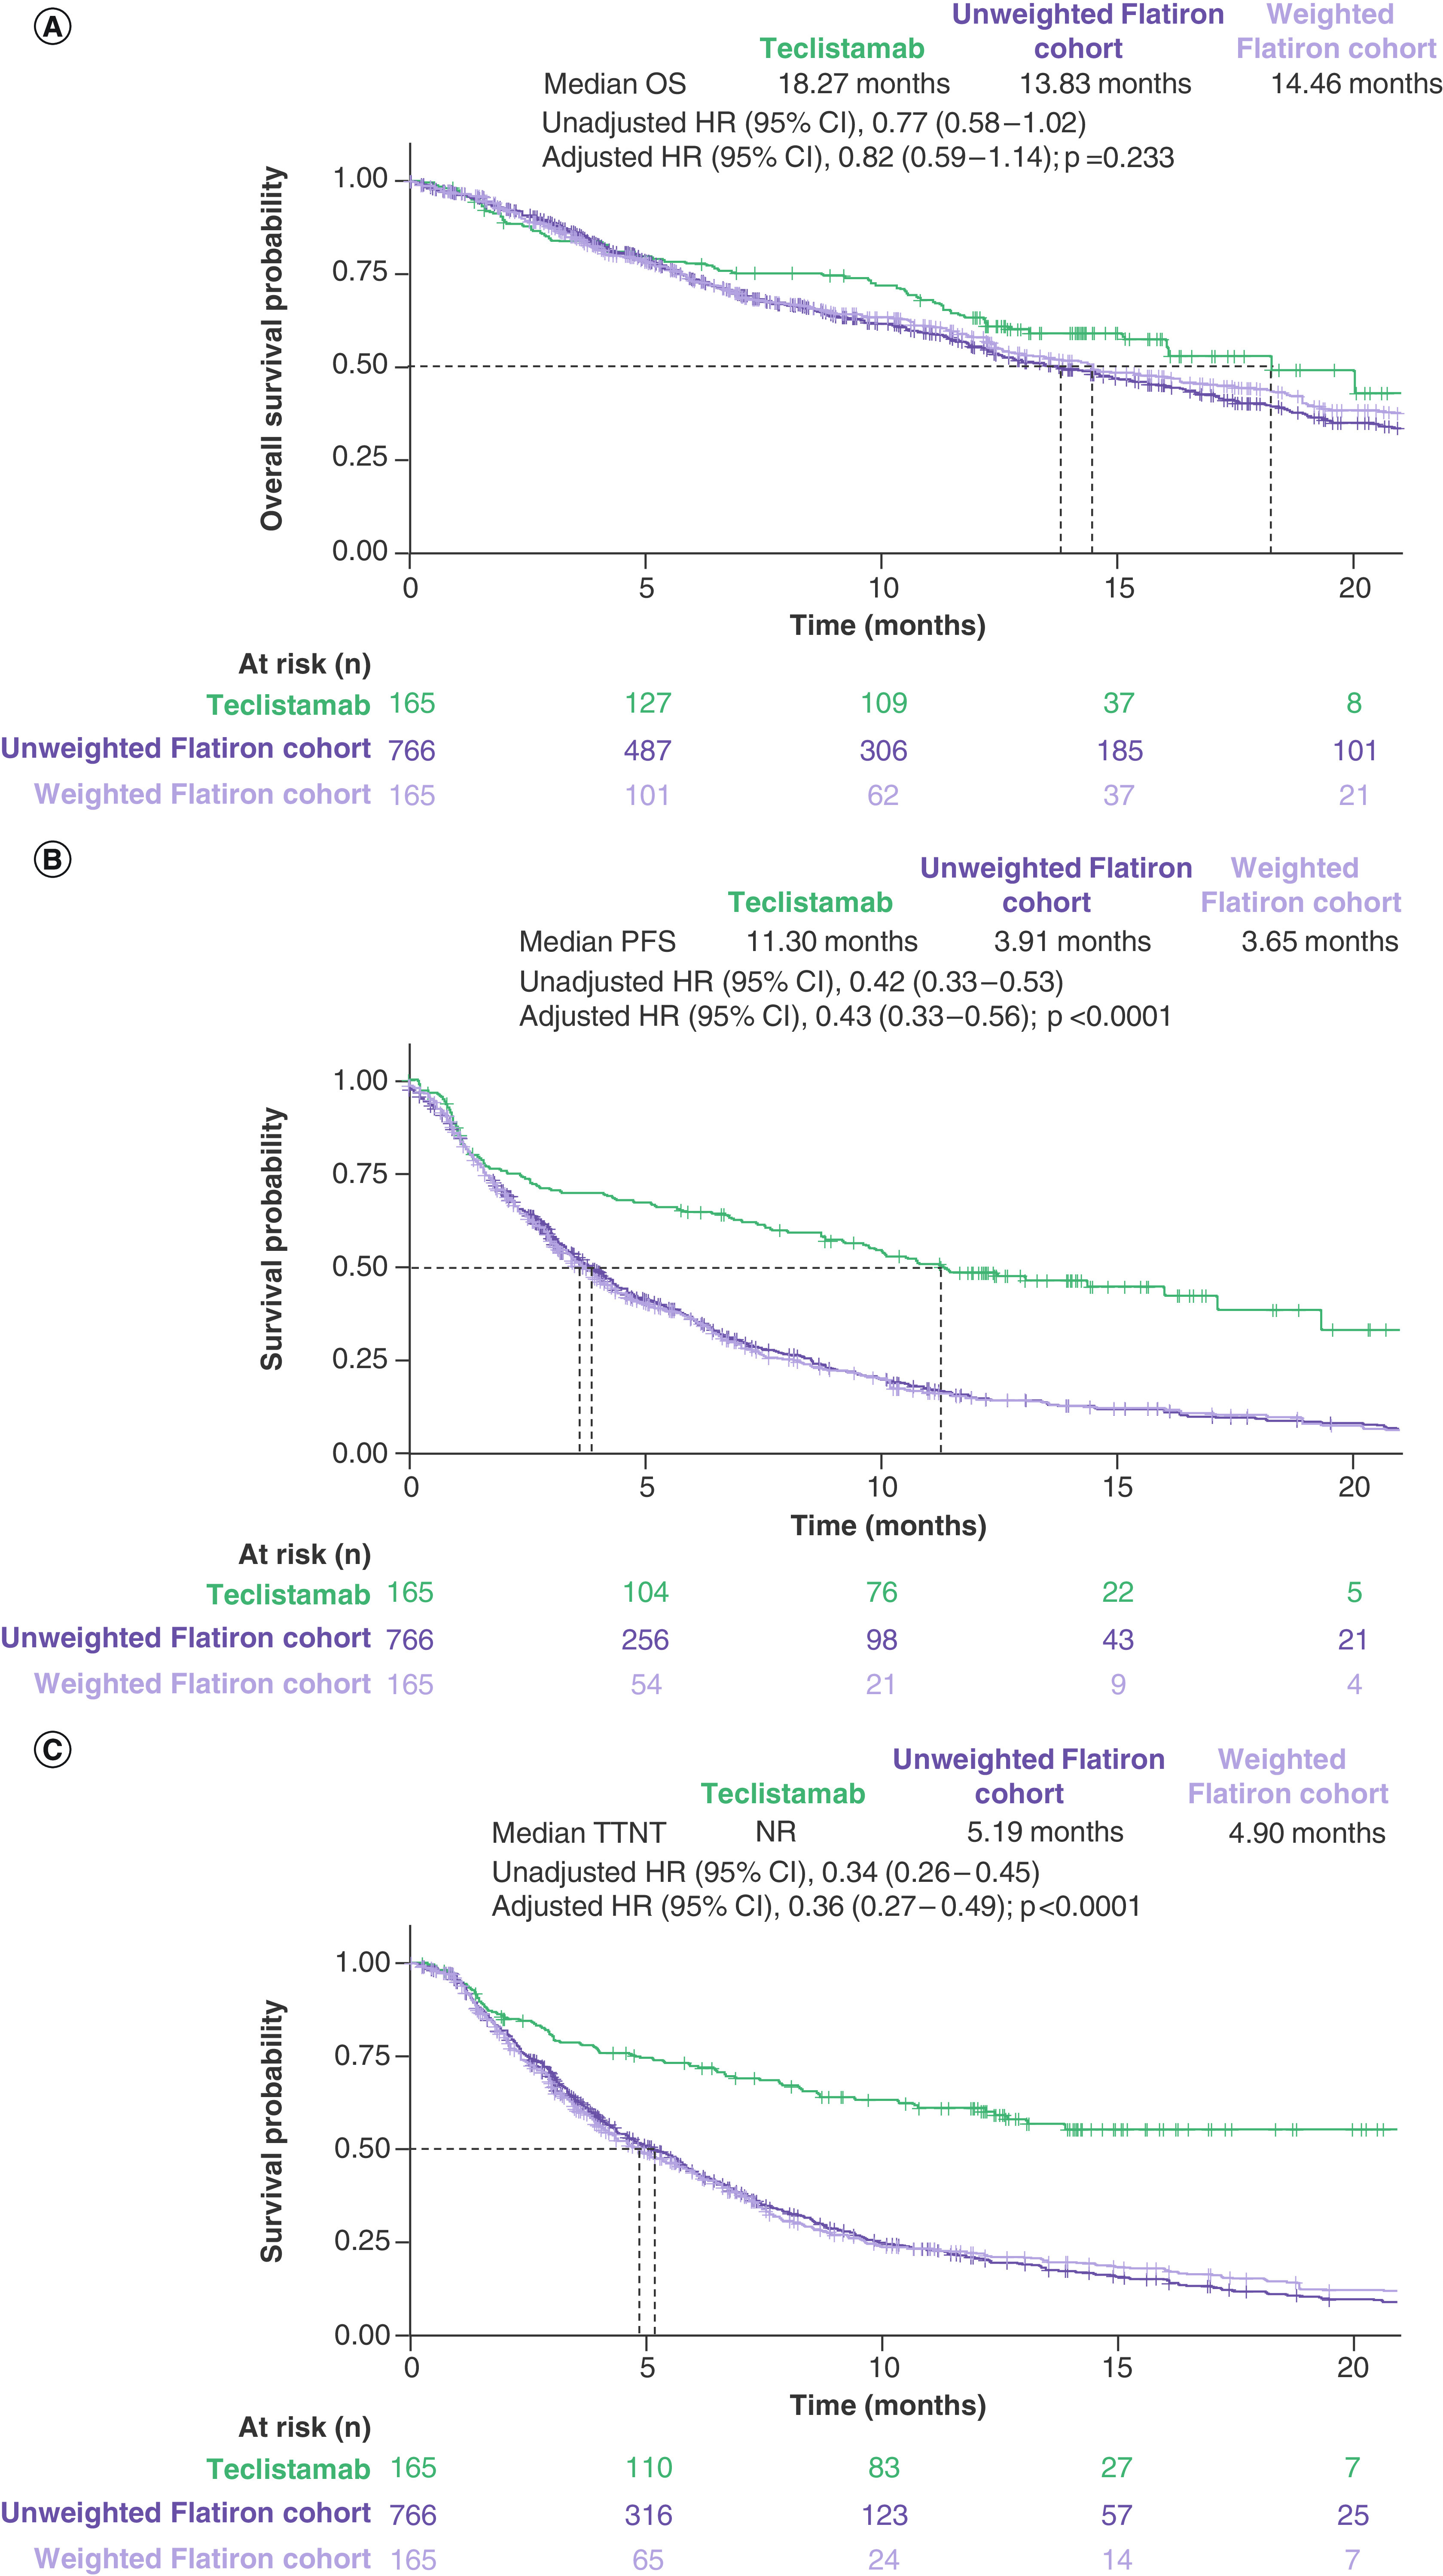
(A) OS, (B) PFS and (C) TTNT. The number of patients at risk is the sum of weights for the cohort-weighted physician’s choice of therapy cohort. Dashed lines indicate median values. Adjusted HRs and adjusted curves reflect IPTW with ATT weights.
†TTNT defined as time to next treatment or death, whichever comes first.
ATT: Average treatment effect in the treated; HR: Hazard ratio; IPTW: Inverse probability of treatment weighting; OS: Overall survival; PFS: Progression-free survival; TTNT: Time to next treatment.