
Figure 4.
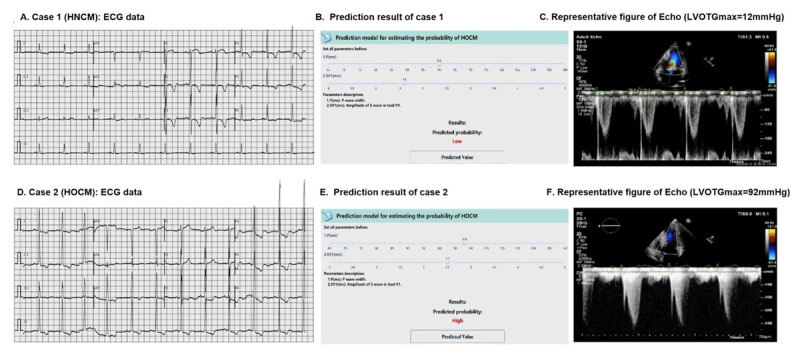
Examples illustration.
A, The ECG of the patient from case 1 (HNCM); B, the prediction result of case 1 with a low HOCM probability; C, Peak LVOTG (12 mmHg) of the patient from case 1; D, The ECG of the patient from case 2 (HOCM); E, the prediction result of case 2 with a high HOCM probability; F, Peak LVOTG (92 mmHg) of the patient from case 2.