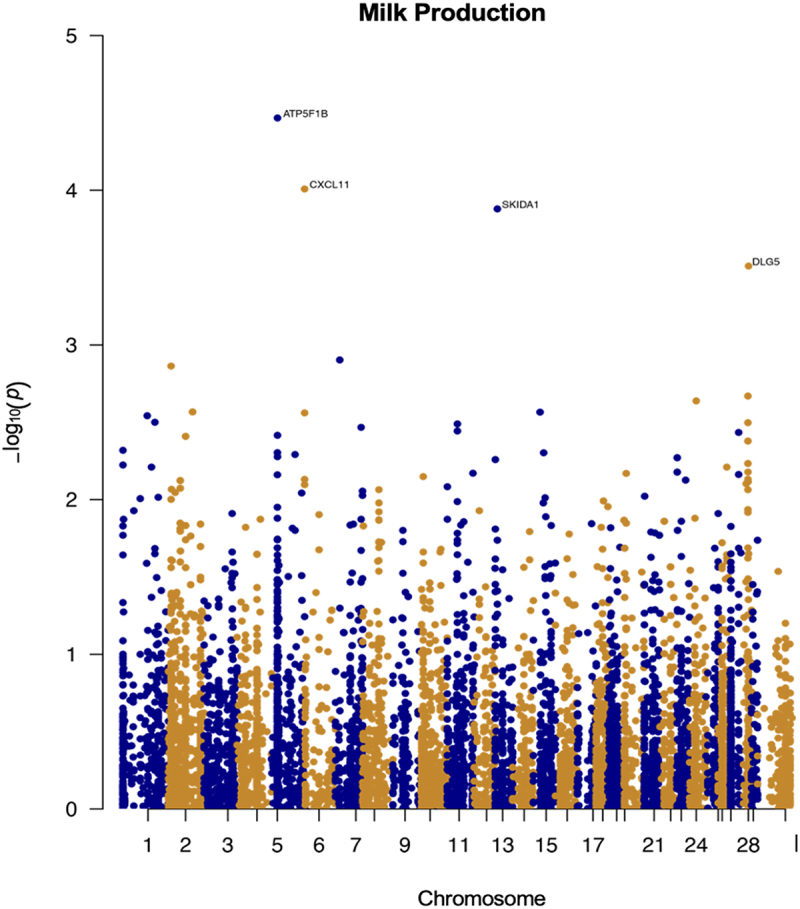
Figure 4.

Epigenome-wide association results for milk production. Manhattan plot representing epigenome-wide association results for milk production. CpG sites are shown on the x-axis ordered by position and the y-axis shows the -log10(p) for the association.
