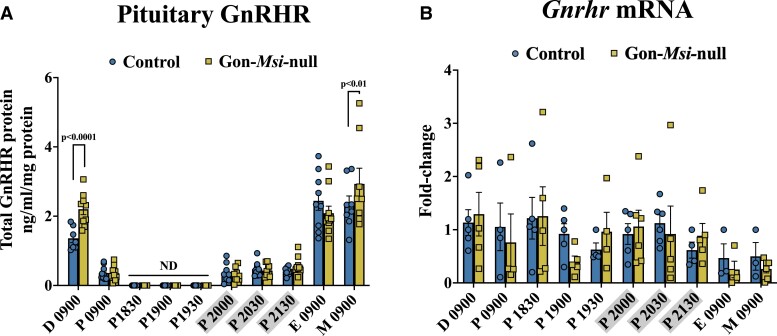
Figure 3.
GnRHR protein and mRNA expression through the estrous cycle in Control and Gon-Msi-null females. (A) Pituitary GnRHR content (measured by enzyme-linked immunosorbent assay [ELISA] and normalized to total protein) is shown for each stage of the estrous cycle as well as for time points bracketing the proestrous LH surge (n = 7-10 pituitaries assayed/group/timepoint). GnRHR protein was not detectable (ND) at 18:30, 19:00, and 19:30 on the evening of proestrus. (B) Gnrhr mRNA was measured by qRT-PCR, and fold-change in Gon-Msi-null Gnrhr levels are shown relative to controls and normalized to Ppia mRNA (n = 3-6 pituitaries analyzed/group/timepoint). For both protein and mRNA, two-way ANOVAs followed by Fisher's LSD tests were used to determine significant differences within timepoints between Control and Gon-Msi-null groups (significance = P value < 0.05). Timepoints that are grayed on the x-axes occurred during the dark cycle.

