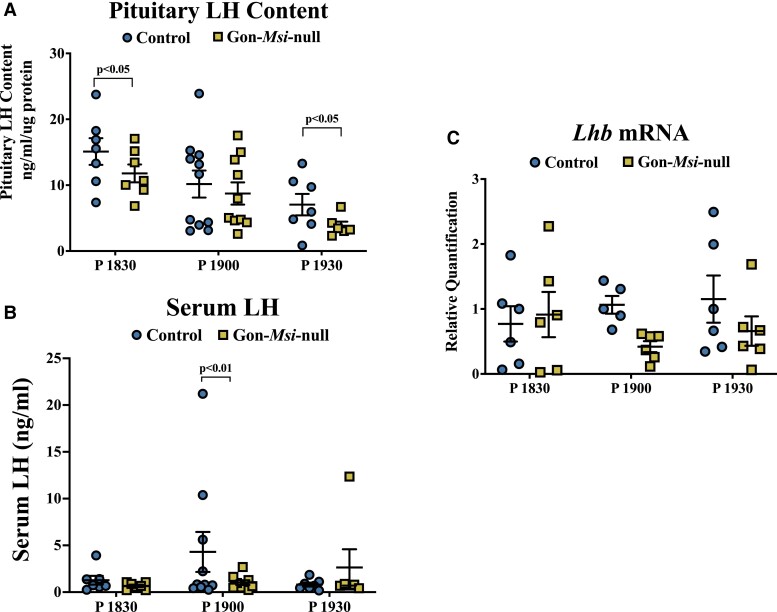
Figure 5.
LH protein pituitary stores, serum levels, and Lhb mRNA in Control and Gon-Msi-null females. Blood and pituitary samples were collected from control (circles) and Gon-Msi-null (squares) females at Proestrus (P) 18:30, 19:00, and 19:30, timepoints that bracket the LH surge in this line of mice. (A) Pituitary and (B) serum content of LH were determined by Milliplex rat pituitary assay (n = 6-11). (C) Pituitary Lhb mRNA was quantified with qPCR and normalized to Ppia mRNA (n = 5-6). Significant differences were determined by two-way ANOVA followed by Fisher LSD test. Significant changes (P value < 0.05) are shown between groups within timepoints only. Data from additional estrous cycle timepoints can be found in Supplementary Fig. S3 (76).

