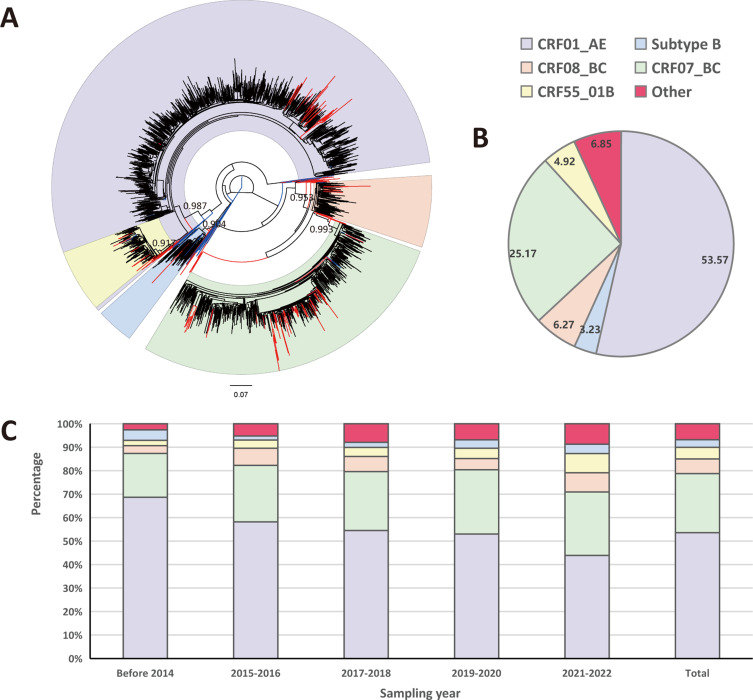
Figure 1.
Distribution characteristics of HIV-1 genotypes in low-level viral load HIV-1 infections in Guangdong, different colors present different genotypes, as shown in the legend. (A) Maximum-Likelihood phylogenetic tree analysis of the genotypes. Blue branch representing the reference sequences including nine subtypes (A–D, F–H, J and K), CRF01_AE, CRF07_BC, CRF08_BC, CRF55_01B, and CRF59_01B. Black branch representing sequences classified as CRF01_AE, CRF07_BC, CRF08_BC, CRF55_01B, and Subtype B. And red branch represents sequences classified as “other” genotypes. (B) Pie chart representing the distribution of HIV-1 genotypes in low-level viral load HIV-1 infections with available sequences from 2011 to 2022. (C) Proportion of various genotypes of HIV-1 circulating throughout the study period, from 2011 to 2022.

