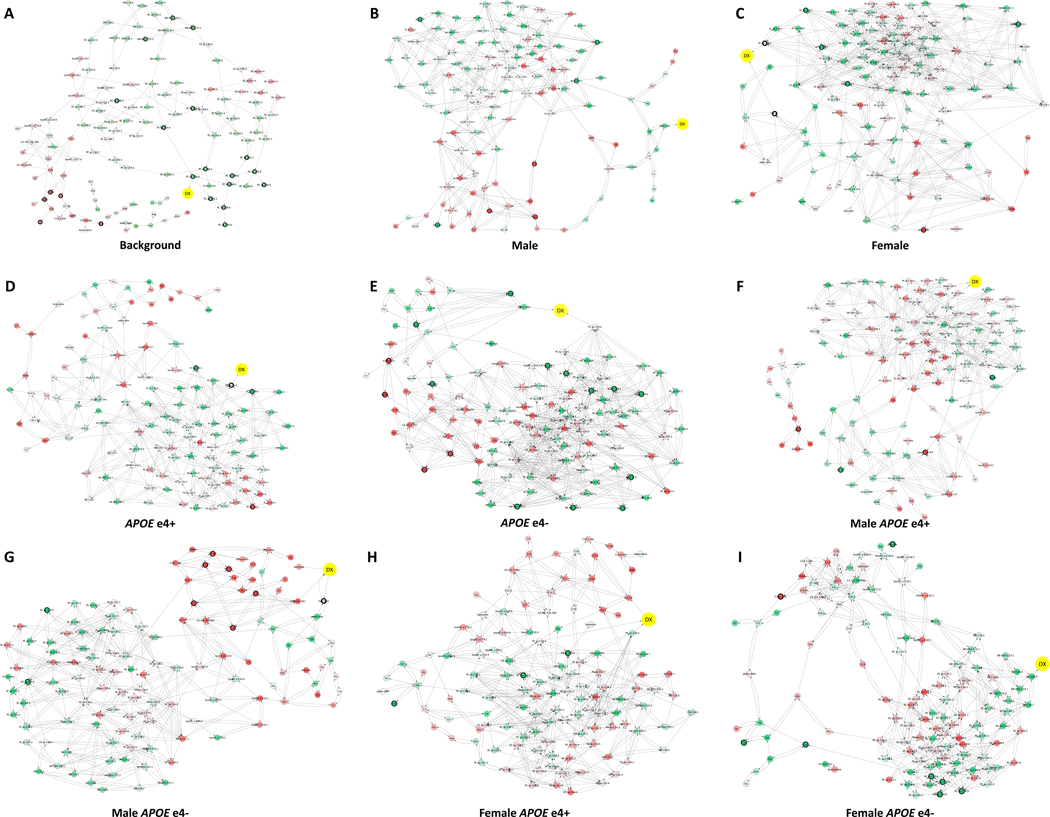
Figure 2. Sex- and APOE-specific consensus predictive metabolic network.
To build consensus causal predictive metabolic network, we subsampled 100 datasets and constructed 100 metabolic networks per patient group. The 95% confidence interval is calculated per edge. The consensus network models were used to identify the upstream metabolites and pathways associated with AD in background with all 656 AD and CN samples (A), males (B), females (C), APOEɛ4+ (D), APOEɛ4- (E), male APOEɛ4+ (F), male APOEɛ4- (G), female APOEɛ4+ (H), female APOEɛ4- (I). Dx, disease diagnosis. Red color indicates metabolites metabolite level is increased in AD comparing to CN; green color indicates metabolite level is decreased in AD comparing to CN. Significant DE metabolites are indicated with black circles.

