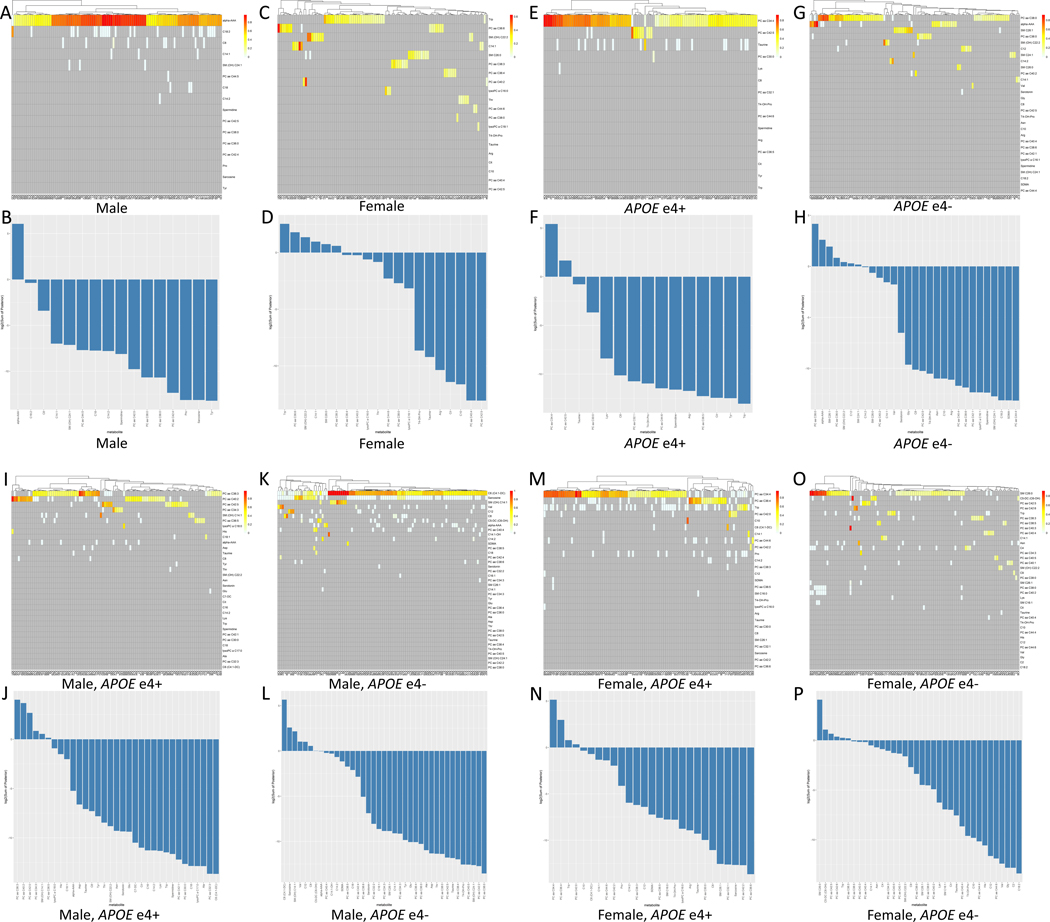
Figure 3. Sex- and APOE-specific metabolic heterogeneity.
In each group, the confidence and robustness of metabolic drivers were shown in the heatmap where the X-axis represents 100 different networks and Y-axis represents candidate key drivers in 100 networks. Each row in the heatmap represents a vector of 100 posterior probability values of the edge from a key driver to Dx derived from 100 networks, and the bar plot is ranked based on the log2 of the sum of the 100 posterior values per key driver in male (A,B), female (C,D), APOEɛ4+ (E,F), APOEɛ4- (G,H), male APOEɛ4+ (I,J), male APOEɛ4- (K,L), female APOEɛ4+ (M,N), female APOEɛ4- (O,P).

