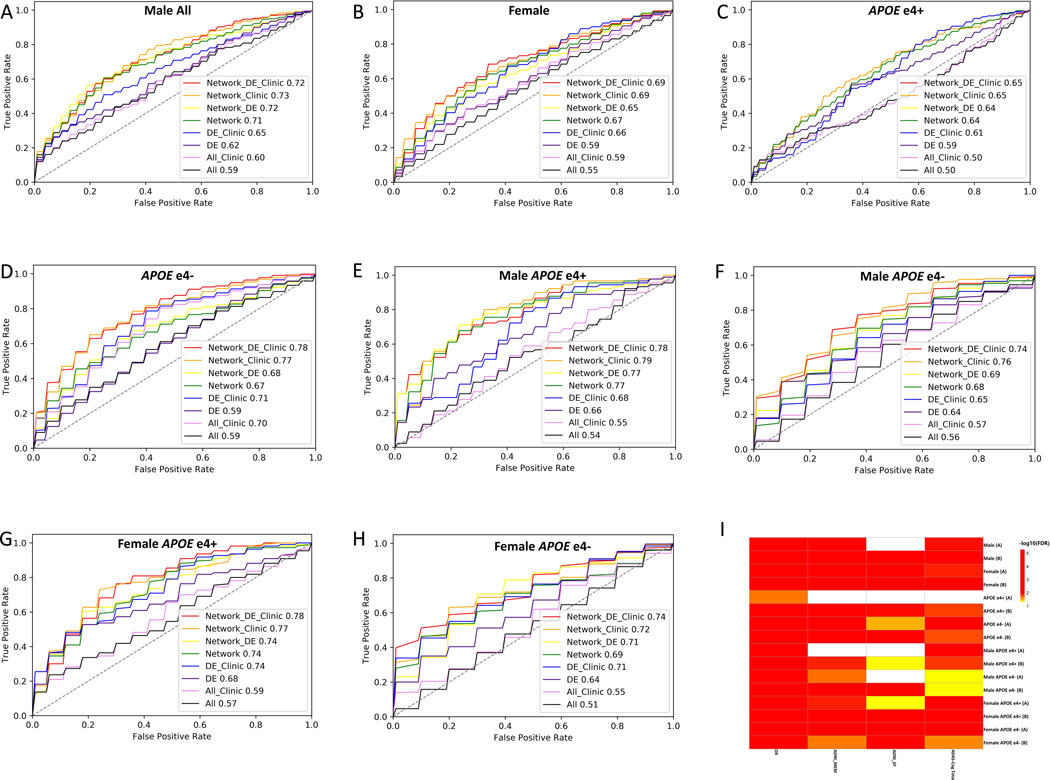
Figure 5. Biomarker panel and cross-validation accuracy for AD diagnosis.
The prediction performance of diagnostic biomarker panels derived from different sets of features are compared in each patient group, The number in the figure represents the averaged cross-validation AUC with 8 feature sets respectively in male (A), female (B), APOEɛ4+ (C), APOEɛ4- (D), male APOEɛ4+ (E), male APOEɛ4- (F), female APOEɛ4+ (G), male APOEɛ4- (H); All, all 127 metabolites in the data; All Clinic, all 127 metabolites in the data combines with age, BMI and/or education; DE: significant DE metabolites; DE Clinic: significant DE metabolites combined with age, BMI and/or education; Network: biomarkers derived from metabolic network; Network_DE: biomarkers derived from the combination of significant DE and metabolic network; Network_DE_Clinic: biomarkers derived from combination of significant DE metabolites, metabolic network and age, BMI, and/or education. Network_Clinic: biomarkers derived from metabolic network and age, BMI and/or education; (I) Two selected optimal biomarker panel association with clinical assessment and cognitive decline: The association of the two selected biomarker panel with and without Age, BMI and Education in each patient group (A: biomarker pane derived from metabolic network; B: biomarker pane derived from combination metabolic network plus age, BMI and/or education) with diagnosis (Dx) and clinical assessments (ADAS-Cog Total Score, memory function (ADNI_MEM) and executive function (ADNI_EF)).

