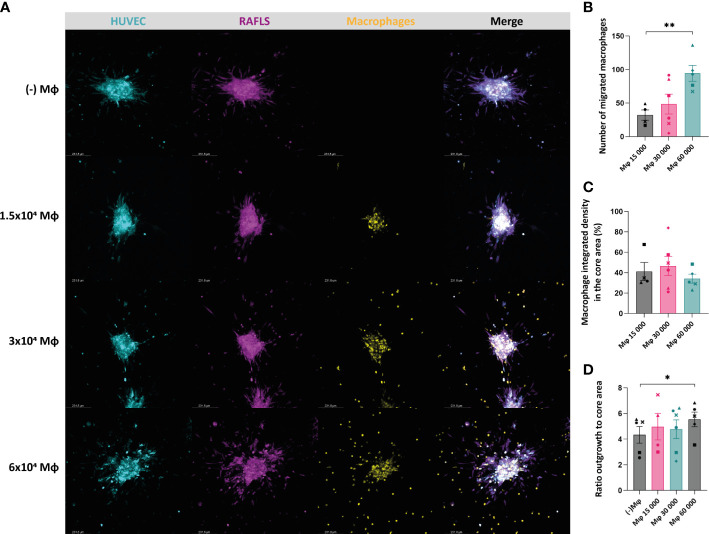
Figure 3.
Incorporation of macrophages results in maintenance of the spheroid structure containing the RAFLS and ECs. Spheroids were all cultured in basal medium. Representative confocal Z-stack projection pictures (10X) of the 3D model containing 3.75x10⁴ RAFLS (magenta), 7.5x10⁴ EC (cyan) and macrophages (yellow) (A). Number of macrophages migrating out from the core detected by QuPath software (n=4-6) (B). Percentage of the total integrated density of macrophages calculated in the core area (n=4-6). Integrated density is the product of mean fluorescence intensity and area (C). Ratio of the spheroid outgrowth area to core area (n=4-6) (D). Statistical significance was determined by RM one-way ANOVA for the analysis of outgrowth ratio and integrated density of RAFLS/EC, and by ratio paired t-test for the integrated density of macrophages (*=p<0.05, **=p<0.01).

