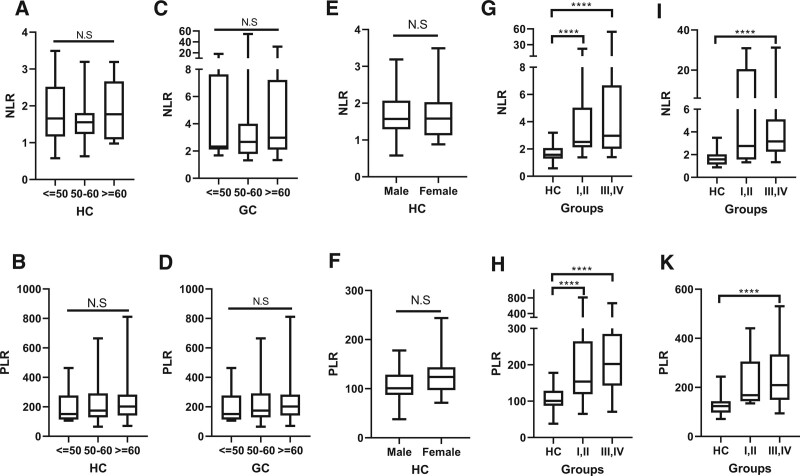
Figure 3.
The distribution of NLR and PLR with age and gender. (A and B) NLR and PLR value on different age groups of HC. (C and D) NLR and PLR value on different age groups of GC patients. (E and F) NLR and PLR value on male and female of HC. (G and H) The comparison of NLR, PLR on male GC patients. (I and K) The comparison of NLR, PLR on female GC patients. GC = gastric cancer, HC = healthy individuals, NLR = neutrophil-lymphocyte ratio, PLR = platelet-lymphocyte ratio.

