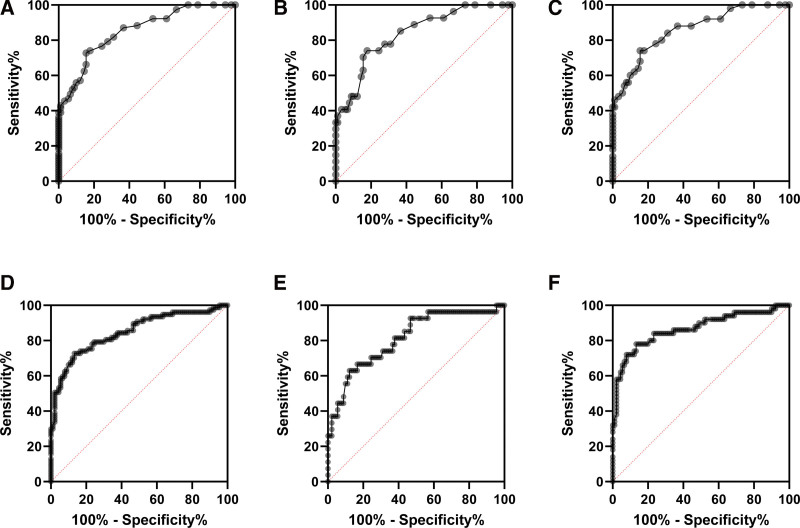
Figure 5.
Receiver operating characteristic (ROC) curve of NLR and PLR value on GC patients. ROC analysis of NLR value on GC patients (A); on stage I and II of GC patients (B); on stage III and IV of GC patients (C). ROC analysis of PLR value on GC patients (D); on stage I and II of GC patients (E); on stage III and IV of GC patients (F). GC = gastric cancer, HC = healthy individuals, NLR = neutrophil-lymphocyte ratio, PLR = platelet-lymphocyte ratio.

