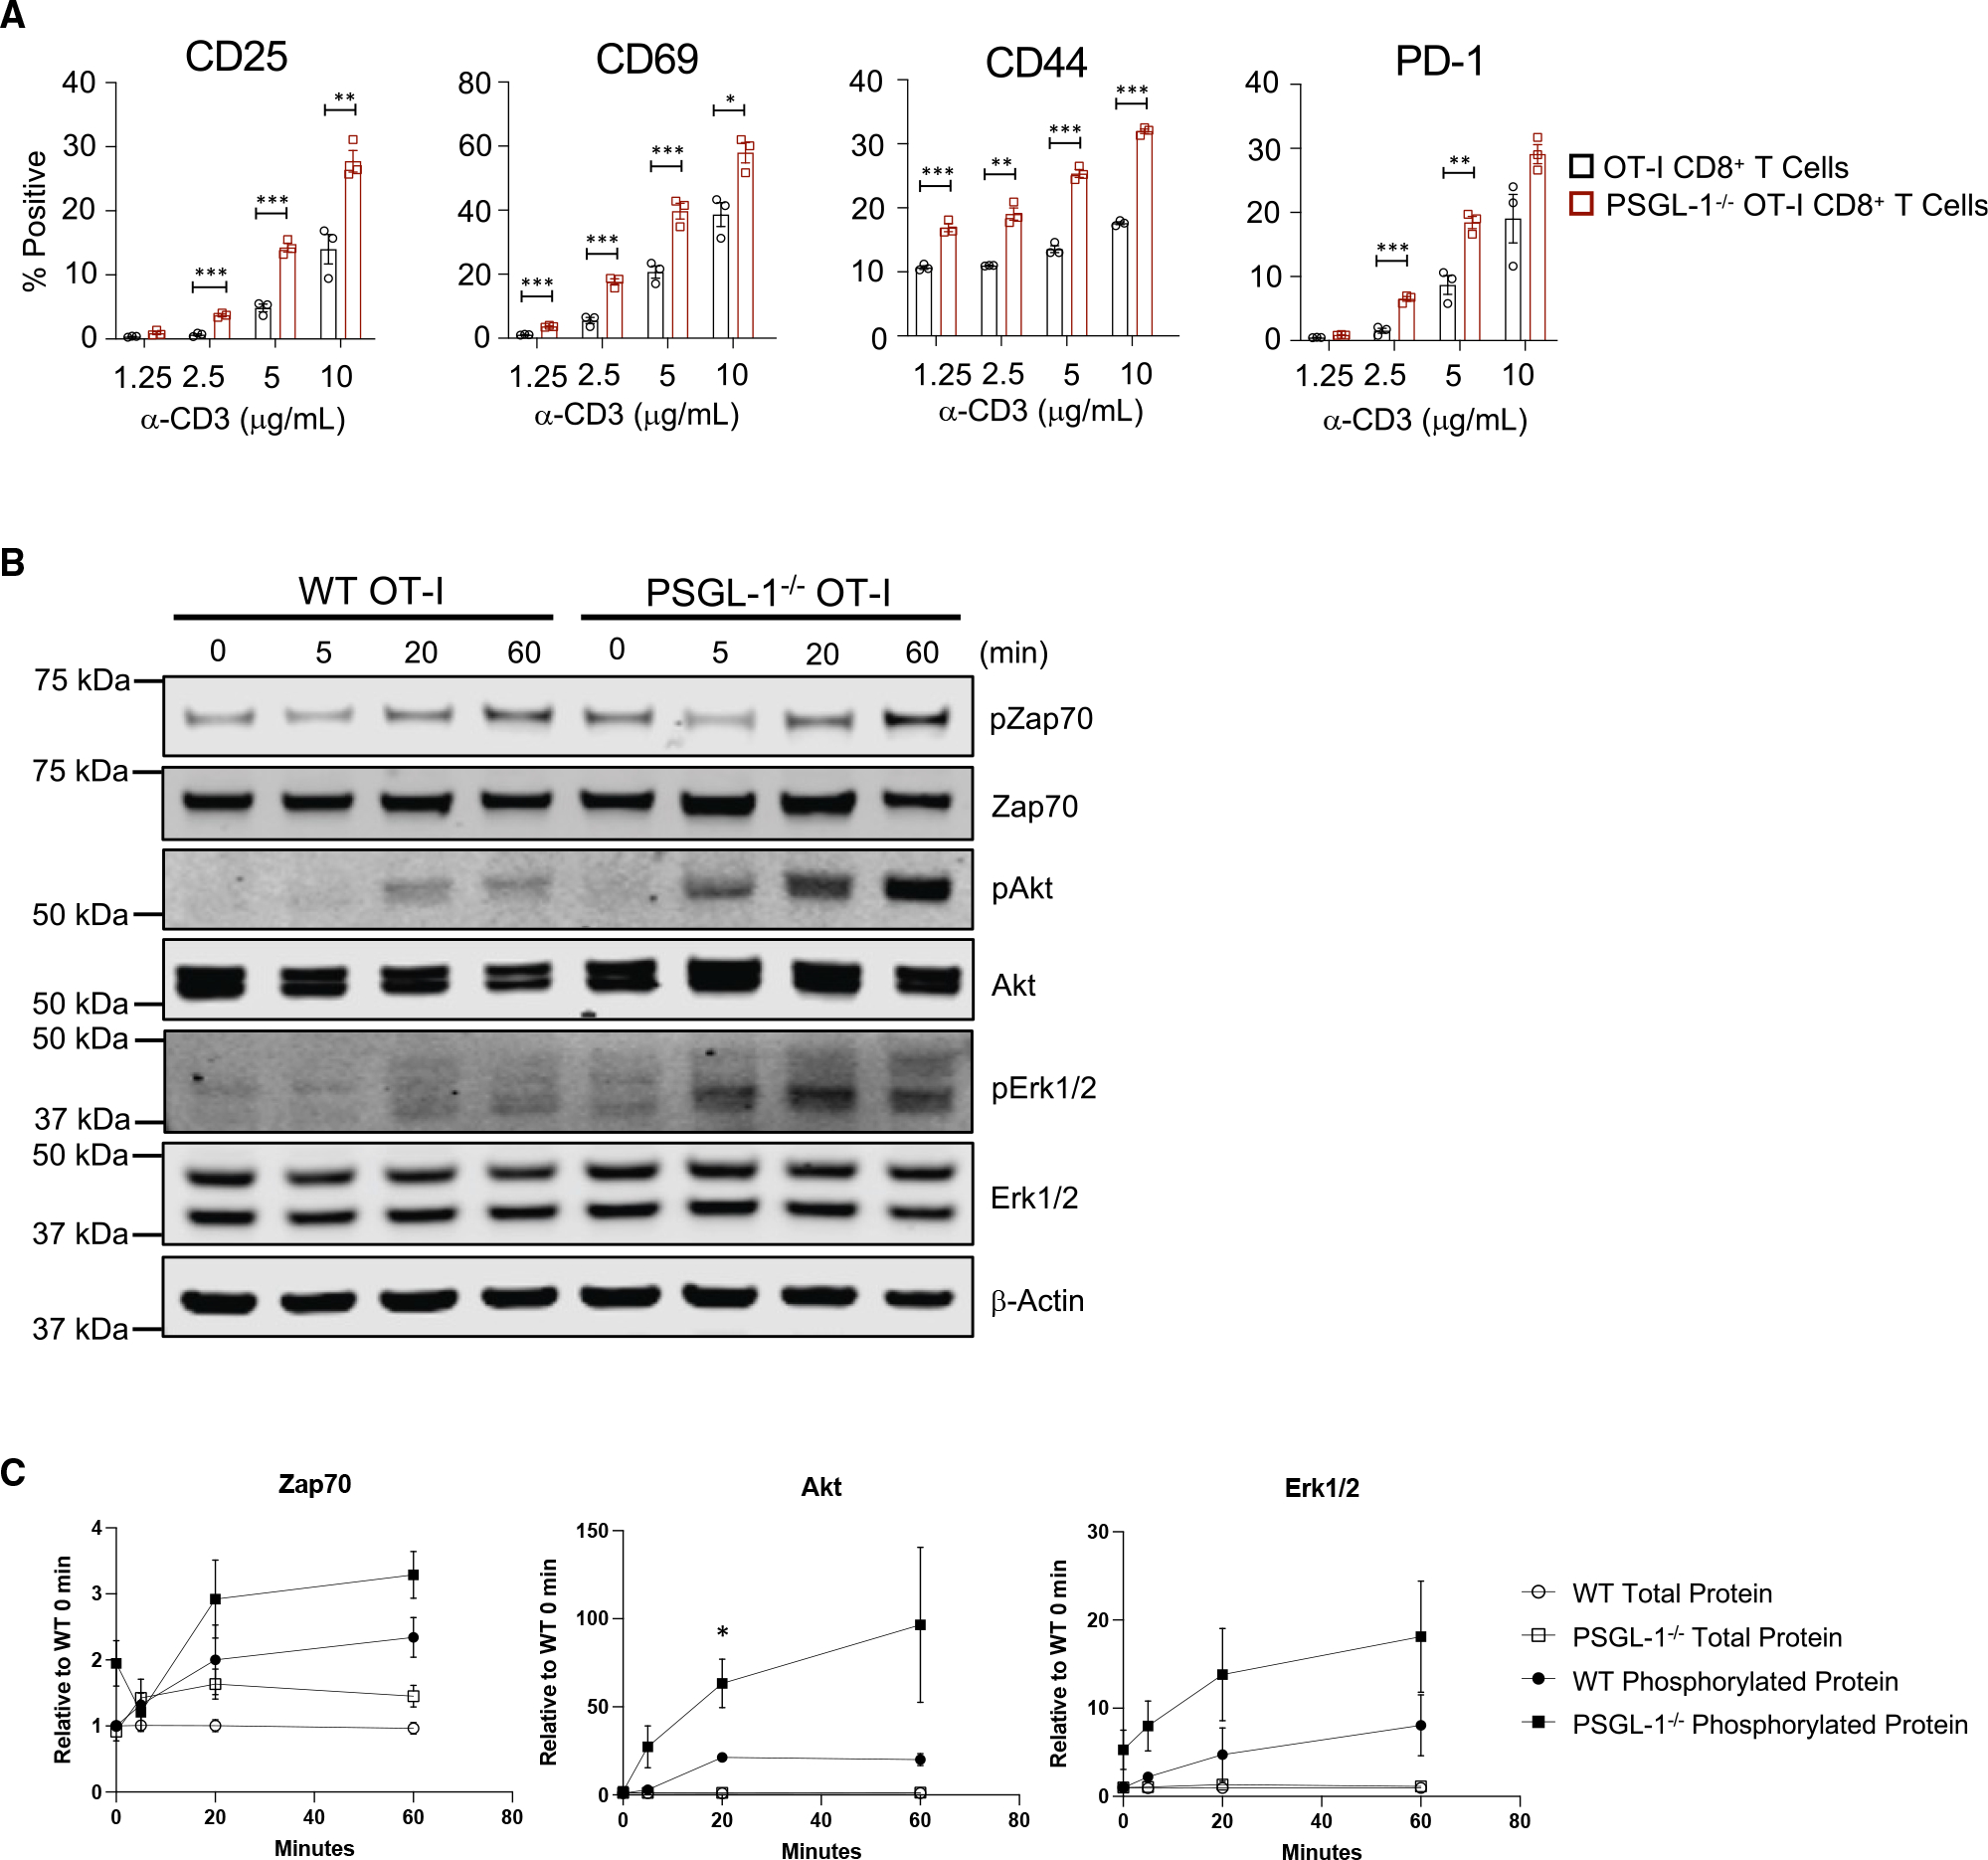
Figure 1. PSGL-1 restrains TCR signaling.

(A) Frequencies of OT-I WT and PSGL-1−/− CD8+ T cells expressing activation markers at 18 h stimulation with anti-CD3ε antibody. Each dot represents an individual mouse. Experiments were performed 2×.
(B) Western blot of phosphorylated and total levels of Zap70, Erk1/2, AKT, and GAPDH in WT and PSGL-1−/− OT-I cells stimulated for the indicated time with anti-CD3ε antibody.
(C) Relative levels of phosphorylated Zap70, Erk1/2, and AKT, normalized to β-actin and relative to the specific protein of interest value in WT samples at 0 min for each blot.
Experiments were performed 3×, 3 mice pooled/genotype, per experiment. (A–C) All data are parametric data except pAkt at 5 min. For parametric data, unpaired t tests were performed; Mann-Whitney test used for non-parametric data. Error bars are SEM. *p < 0.05, **p < 0.01, ***p < 0.005.
See also Figure S1.
