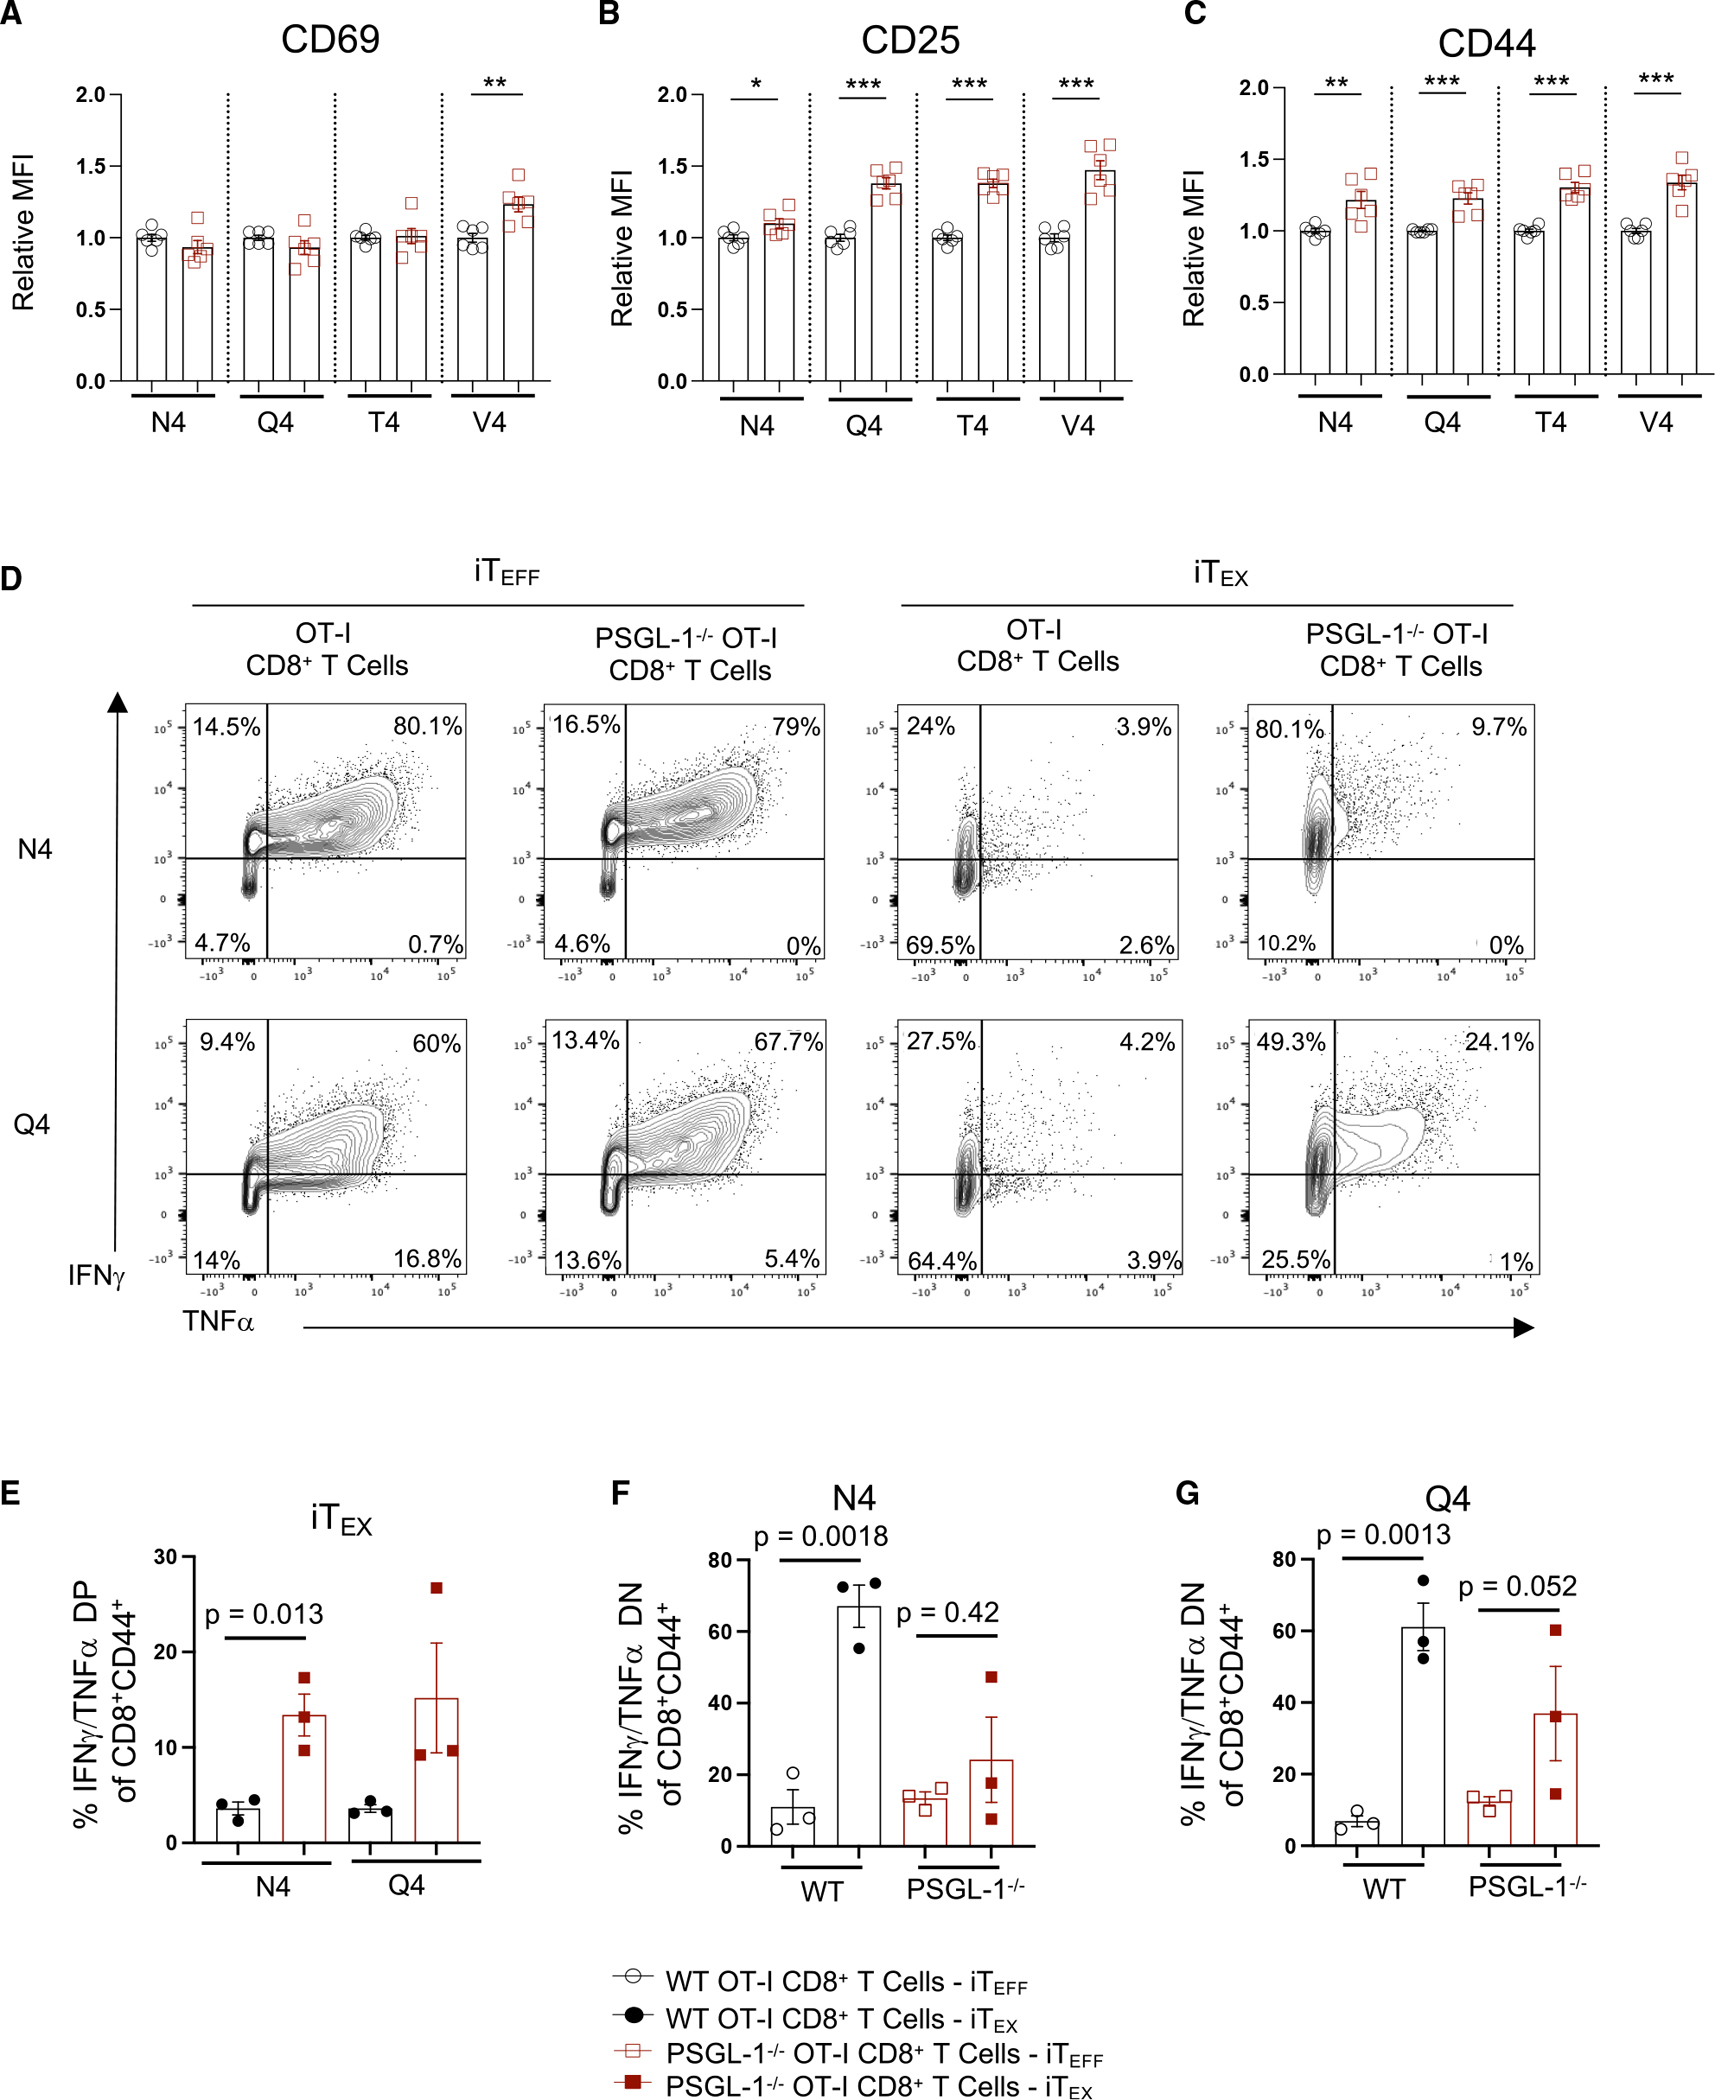
Figure 2. PSGL-1 deficiency promotes increased TCR signaling sensitivity.

WT and PSGL-1−/− OT-I CD8+ T cells were stimulated with ovalbumin (OVA) peptide-pulsed activated splenocytes.
(A–C) Expression of (A) CD69, (B) CD25, and (C) CD44 was assessed by flow cytometry. OVA peptides of varying TCR affinities were used for stimulation: N4 (SIINFEKL), Q4 (SIIQFEKL), T4 (SIITFEKL), or V4 (SIIVFEKL).
(D–F) WT and PSGL-1−/− OT-I cells were cultured under effector (single stimulation; iTEFF) or exhaustion conditions (repeated stimulation; iTEX) with N4, Q4, T4, or V4 OVA peptides.
(D) Flow cytometry plots of IFNγ and TNF-α production by cultured WT and PSGL-1−/− OT-I cells restimulated on day 5 with SIINFEKL for 5 h.
(E) Frequency of double-positive IFNγ- and TNF-α-producing OT-I cells from WT (black circles) or PSGL-1−/− mice (red squares) following iTEX culture with either SIINFEKL or SIIQFEKL peptide.
(F) Frequency of double-negative (non-IFNγ- or -TNF-α-producing) OT-I cells from WT or PSGL-1−/− mice following iTEFF (open symbols) or iTEX (closed symbols) culture with N4 peptide.
(G) Frequency of double-negative (non-IFNγ- or TNFα-producing) OT-I cells from WT or PSGL-1−/− mice following iTEFF (open symbols) or iTEX (closed symbols) culture with Q4 peptide.
(A–F) Each dot represents an individual experiment from a pooling of 1–2 mice/genotype/experiment, experiments were performed 3×. Data are parametric; unpaired t tests were performed. Error bars are SEM. *p < 0.05, **p < 0.01, ***p < 0.005.
