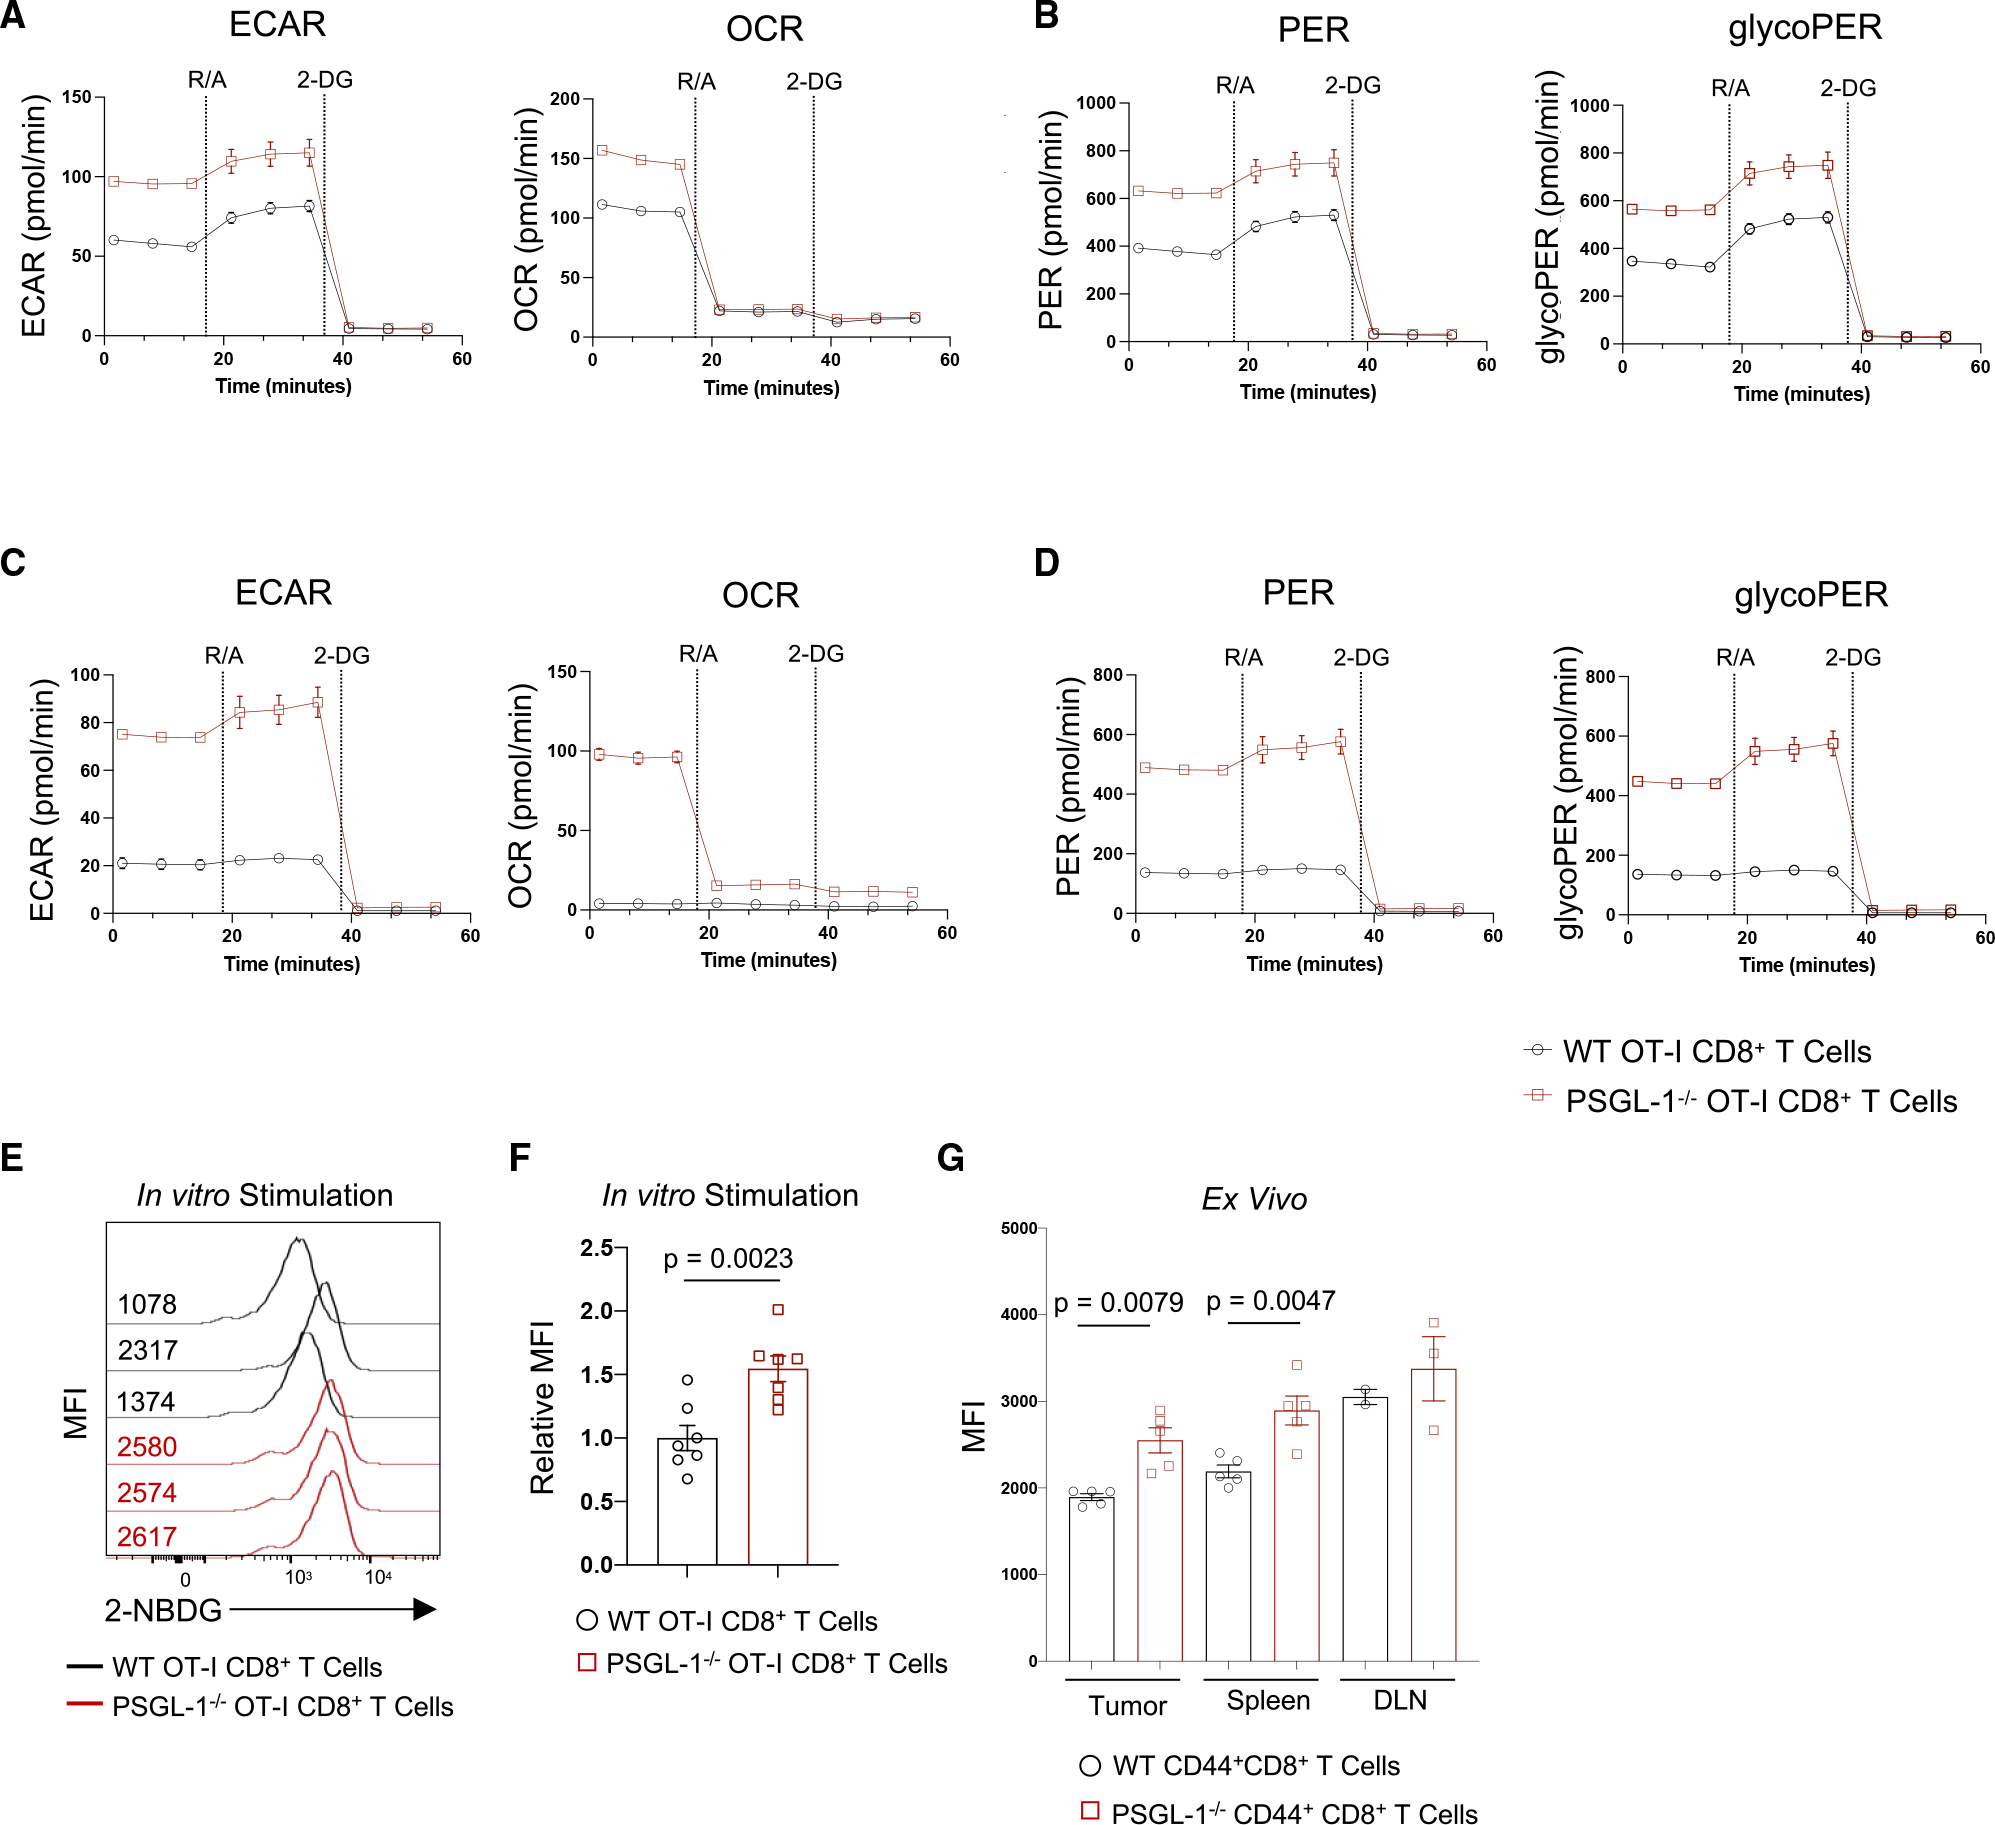
Figure 4. PSGL-1 restrains glycolysis in CD8+ T cells.

(A) Extracellular acidification rate (ECAR) and oxygen consumption rate (OCR) were assessed using the Seahorse Glycolytic Rate Assay in 3 day activated WT or PSGL-1−/− OT-I CD8+ T cells.
(B) Proton efflux rates (PERs) and glycolytic PER (glycoPER) calculated based on (A).
(C) ECAR and OCR were assessed for iTEX OT-I cells or PSGL-1−/− OT-I cells on day 5.
(D) PER and glycoPER calculated based on (C).
(A)–(D) are representative of >3 experiments.
(E and F) Histograms (E) and graph (F) of 2-NBDG uptake in OT-I or PSGL-1−/− OT-I cells after 2 h stimulation with SIINFEKL peptide; each line/dot represents an individual mouse. Data are normally distributed.
(G) Graph of ex vivo 2-NBDG MFI values in CD44+CD8+ T cells from tumors, spleens, or tumor draining lymph nodes (DLNs) of WT or PSGL-1−/− mice bearing YUMM1.5 tumors.
Data in (D) and (G) are parametric except for WT tumors and DLN. For parametric data, unpaired t tests were performed; Mann-Whitney test used for non-parametric data. Error bars are SEM. Each dot in tumors and spleens represents an individual mouse; DLN represents a pool. Experiments were performed 2×.
