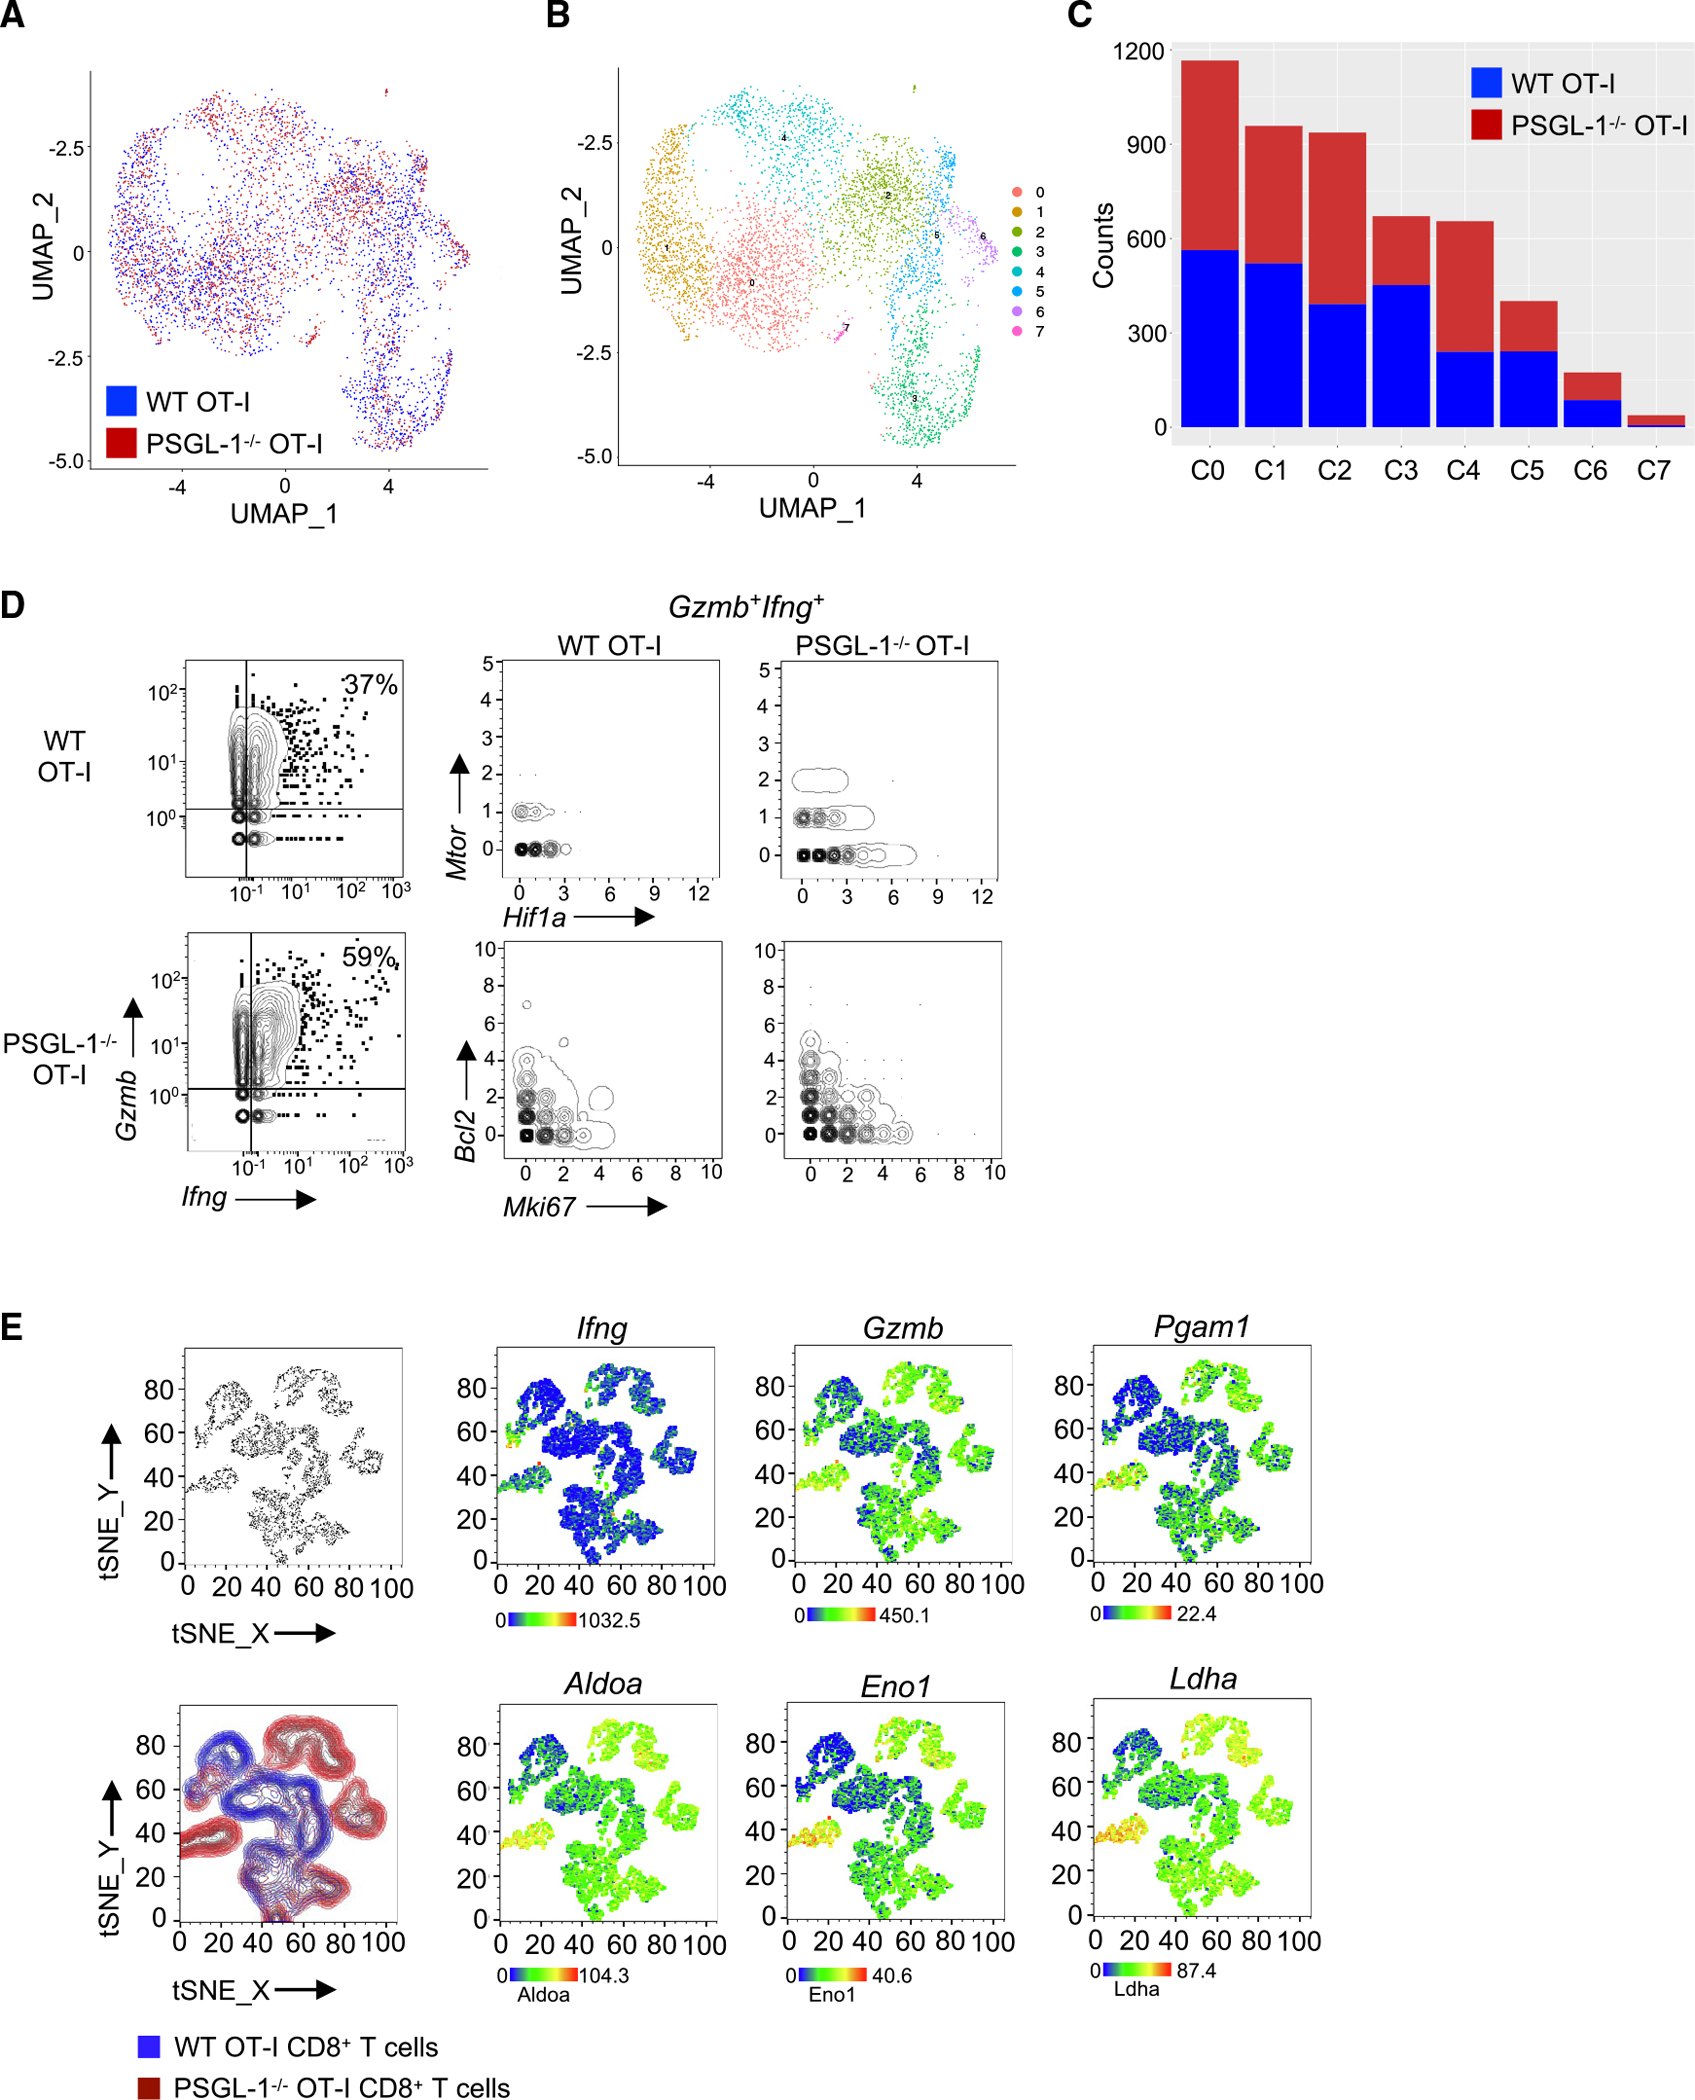
Figure 5. Single-cell sequencing reveals enhanced metabolic state of intratumoral PSGL-1−/− CD8+ T cells.

1 × 10⁶ activated WT OT-I (CD45.1+) or PSGL-1−/− OT-I (CD90.1+) T cells were injected into C57BL/6 mice 7 days after B16-OVA injection, and donor OT-I cells were sorted from tumors 6 days later for single-cell RNA sequencing.
(A) UMAP analysis (Seurat) of TILs.
(B and C) Composition analysis showing the breakdown of WT OT-I cells (pink) vs. PSGL-1−/− OT-I cells (green) overlaying the UMAP (B) and the number of counts of each per cluster (C).
(D) SeqGeq analysis of Gzmb and Ifng expression in WT and PSGL-1−/− OT-I cells (left). Top right: gene expression of Mtor and Hif1a in Gzmb+Ifng+ WT and PSGL-1−/− OT-I cells. Bottom right: gene expression of Bcl2 and Mki67 in Gzmb+Ifng+ WT and PSGL-1−/− OT-I CD8+ T cells.
(E) SeqGeq tSNE clustering of WT (blue) and PSGL-1−/− (red) OT-I cell libraries. Gene expression overlays of Ifng, Gzmb, Pgam1, Aldoa, Eno1, and Ldha in 1,000 single cells per condition from 6 mice per genotype.
See also Figure S5.
